
The Federal Reserve plays an ever-increasing, complex role in the U.S. economy. By significantly expanding its scope, the Fed is now the single most important economic factor influencing the financial markets.
The Federal Reserve is, no doubt, a complex topic, perhaps one of the most challenging areas within finance. Few people know the Fed’s mandates. Fewer still understand how the Fed executes its stated economic policies.
In this multi-part series, I aim to explain what the Fed is, what the Fed has done, and why it matters.1
Overview & My Accidental Discovery
This is Part 1, which explores the Fed actions during the last recession. I wanted to begin the discussion in the 2009 – 2010 era for several reasons:
- This event was a significant expansion of the Fed.
- The actions taken during this time set a new precedent for how the Fed could react to economic shocks.
- Now a decade later, we can better evaluate the Fed’s actions with the benefit of hindsight, and with actual data on economic outcomes.
- It serves as a benchmark to compare to the 2020 Fed actions, to get a sense of scale-of-intervention.
As I was polishing my final edits to publish Part 1, I decided to double-check my Excel work, to ensure my data and analyses were correct. Looked good.
I thought, “Maybe I should use one specific mortgage-backed security as a case study to better illustrate the Fed’s actions for my readers.”
So, I picked one example and dove in a little further. In doing so, I happened upon something odd. I accidentally uncovered what appears to be corruption, buried in the data… data provided by the Fed itself. It seems…
The big Wall Street banks not only off-loaded their risky mortgage-backed securities to the Fed (as planned), they also pocketed a substantial profit simultaneously trading against the Fed, gouging the Fed (and the rest of us) in the process.
To greed, there is no limit.
I had not planned to uncover this. In fact, this discovery caused me considerable angst. Not to mention even more Excel time. And thinking. And writing. And editing. And contemplating if I should publish this.
But that’s where the data took me. Consequently, the end of Part 1 includes a detour to discuss this oddity in more detail. Honestly, it’s quite concerning.
But first, let’s start where I originally began… with an introductory discussion of the Fed and its actions during the 2009-2010 recession.
Here we go…
Understanding the Federal Reserve
I have a finance background and have studied the Fed in some detail. I have also read the Federal Reserve’s audited annual report, including all 35 pages of footnotes. With that, I can truthfully say… I still don’t really understand the Fed. If there is any consolation for the rest of us, it is this:
No one fully understands the Fed.
In fact, it’s not entirely obvious the Fed understands itself, certainly not the second- and third-order derivatives of its actions.
Because of the complexity, I initially wrote A Children’s Story for Adults, ostensibly about the Fed, as a precursor to this series to help illustrate the mechanics of the Fed’s operations in simple terms. This may be the first and only children’s story about the Federal Reserve. It’s not exactly normal bedtime material for kids.
Purpose of the Federal Reserve
The Federal Reserve is the Federal Bank of the United States, created by Congress in 1913.
The Fed has four stated primary purposes:
- Create monetary policy to aim for full employment and stable prices.
- Regulate banks.
- Maintain stability of the financial system.
- Provide financial services to the U.S. government and oversee the nation’s payment systems.
Fed Expansion (2009)
As a starting point for our discussion, let’s zoom in on the Fed’s actions during the 2008+ financial crises when the Fed deemed it necessary to enact a massive bailout to (presumably) prevent the entire financial system from imploding.2
But first, what does it mean to “bailout” financial institutions?
Background
The primary driver for the economic turmoil in late 2008 was an extreme inflation of real estate prices in the preceding years, prompted in part from years of massive speculation, enabled by inexpensive financing, lovingly provided by financial engineers who devised new-fangled products called mortgage-backed securities (MBS). These securities delivered enormous capital inflows into the real estate market, allowing people to purchase real estate with loads of debt at lower interest rates than they should have been able to procure.
What’s strange is that nearly everyone saw it coming. Real estate was way into bubble-level pricing by 2007. Everyone knew, at some point, we would experience a day of reckoning from the inflated real estate prices.
This idea was discussed openly at extended family gatherings over the holidays, several years in a row (OK, maybe just my family). We were perplexed that lenders were approving people for mortgages who could not possibly afford to repay their loans, unless the property increased in value and established sufficient equity such that it could be refinanced again (or sold to the next sucker speculator).3
People were buying real estate, simply betting it would go up within a few months, and then selling it for a profit to the next person attempting the same.
Numerous speculative buyers with access to inexpensive funding, fueled greater buy-side demand and therefore increased prices for real properties. There were no fundamental reasons (like high population growth) for real estate prices to inflate so rapidly, except more and more speculators with cheap funding, an unsustainable trend.
Without going into all the financial engineering details of mortgage-backed securities, suffice it to say, the value of these securities was primarily grounded on the notion that real estate would continue to go up.
And then it didn’t.
The whole thing was like playing musical chairs. When the music stopped, someone would be without a chair. The difference is, tens of thousands of people were playing with only a few hundred chairs. When the music stopped, piles of people, companies, investors, endowments, trust funds and sovereign wealth funds thumped on the floor.
The bubble burst, as all speculative financial bubbles do. This left the banks holding heaps of devalued mortgage-backed securities, suddenly worth considerably less than they were thought to be worth. Yikes!
With the drop in real estate prices, and banks in trouble, lending tightened. This resulted in a decline in real estate prices (as there were fewer buyers because the cheap mortgages disappeared, seemingly overnight).
Big Banks at Risk
Because the banks holding these securities were primarily large institutions, the Federal Reserve feared the whole banking system might collapse if the big banks failed. It was a complete quagmire.
So, the Federal Reserve stepped in and purchased baskets of these mortgage-backed securities from the banks.4 This moved the “toxic assets” off the banks’ balance sheets and on to the Fed’s balance sheet. Lucky them.
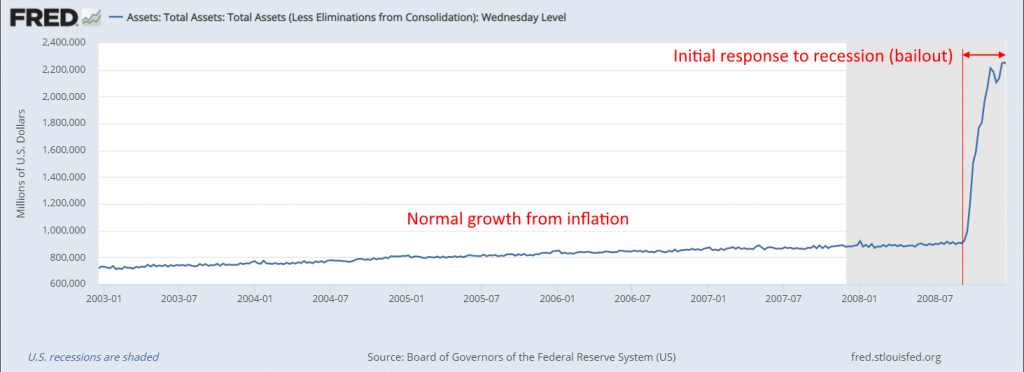
To understand the extreme and sudden measures taken by the Fed in 2008+, look at the change in the Fed’s balance sheet, relative to historical levels and volatility.
But where did the “toxicity” really move to? Ultimately, to the American people. We collectively inherited the upside and the default risk for these securities.
The interesting bit here – the Fed has made public the exact trades it made of mortgage-backed securities, both purchases and sells (strangely) and from which banks. Now we can follow the money to see where it went and, with the benefit of elapsed time, assess what became of this bailout.
Which Banks Sold Mortgage-Backed-Securities to the Fed?
The Fed made 10,058 MBS (buy/sell) transactions over the 19-month period (from January 2009 – July 2010). And so, my spreadsheet begins with 10,058 rows of transaction data.5
To shorten and simplify the presentation, I created the summary table below, which shows the total dollar amount of mortgage-backed securities the Fed purchased from each individual bank. I also included a column to show subsequent sales of Fed-purchased MBS.6
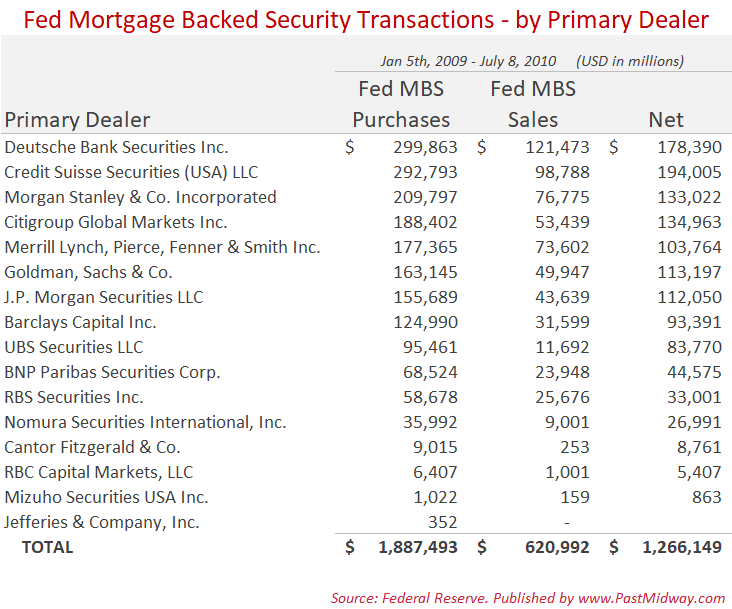
To be clear, these figures are in millions, which means the Fed bought $1.89 trillion in MBS over this time (and sold $620 million back to the banks for a net purchase of ~$1.27 trillion).
This was an enormous increase in the role of the Fed compared to historical actions.
Also, two large banks are notably missing from this list:
- Bank of America – the 2nd largest U.S. bank, now with $2.2 trillion in assets
Mortgage-Backed Securities Purchased by the Fed Over Time
I also plotted the dollar-quantity of MBS the Fed purchased over time, by month.
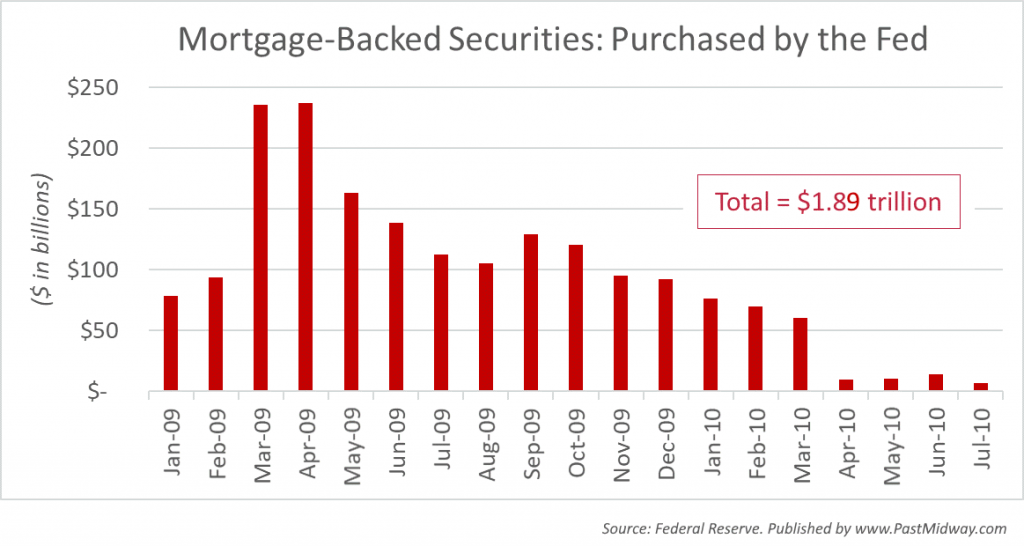
In short, the Fed’s policy change to invest in mortgage-backed securities resulted in a massive expansion of the Fed’s balance sheet, starting in 2009.7
Generally, the Fed dumped about $100 billion per month into the mortgage-backed-security market (and more than $200 million in March and April)! This was a huge intervention into the financial markets – and completely unprecedented.
A key point here is the scale in which the Fed intervened with liquidity (mostly on the buy-side) during the 2009 recession.
In Part 2 of this series, we will compare the size of this massive intervention to the Fed’s economic response in 2020. That was the point of starting our discussion with the 2009-2010 recession… to benchmark and compare the size/scale/scope with the 2020 intervention. But let’s not get ahead of ourselves. There’s more to discuss here.
Were These Good Investments or Not?
Now, more than a decade later, I was curious, did the Fed overpay or under-pay for these mortgage-backed securities?
Keep in mind, this was an exceptionally uncertain time. Liquidity had gone to zero for mortgage-backed securities. Consequently, a “fair market price” did not exist. There were literally no buyers. So how could the Fed price these MBS baskets to purchase them?
Who knows?
But what we now know is exactly what the Fed purchased, how much it purchased, and how it turned out… discussed next.
To estimate the return on investment for these MBS purchases, I reviewed the $620 billion MBS the Fed sold from Jan 2009 – July 2010. For each sale of a specific security (they have unique identifiers), I matched these to the purchase price the Fed paid for the same security. From this we can determine the realized gains and losses for each purchase and subsequent sale the Fed made of mortgage-backed securities.
[Price Sold] – [Price Paid] = [Net Gain/Loss]8
Applying this percentage gain/loss to each respective security basket provides a return estimate for each basket.
To abbreviate the presentation, I’m only showing the performance of the largest 10 positions in the summary table below.9
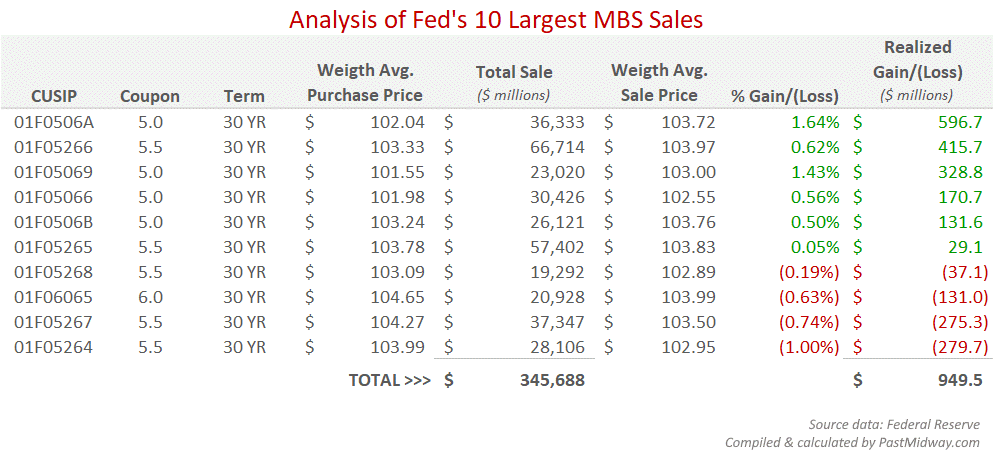
At least for these 10 specific securities (the largest positions), the Fed showed a net gain of nearly $1 billion… PLUS any coupons paid while the Fed held these assets.
I also calculated the returns for all 42 securities where the Fed both purchased and sold (sometimes not in that order and often in multiple round-trips). Including all these transactions, the Fed sold $620 billion in MBS with a total return of 0.3% (including the smaller positions didn’t change the return much).
FED’s Realized Gains & Losses by Coupon
I was curious if the Fed’s realized returns differed by coupon rates. The graph below shows the Fed’s profits and losses segregated by the coupon rates.
The Fed’s $620 billion in MBS exits resulted in a profit of $1.96 billion.
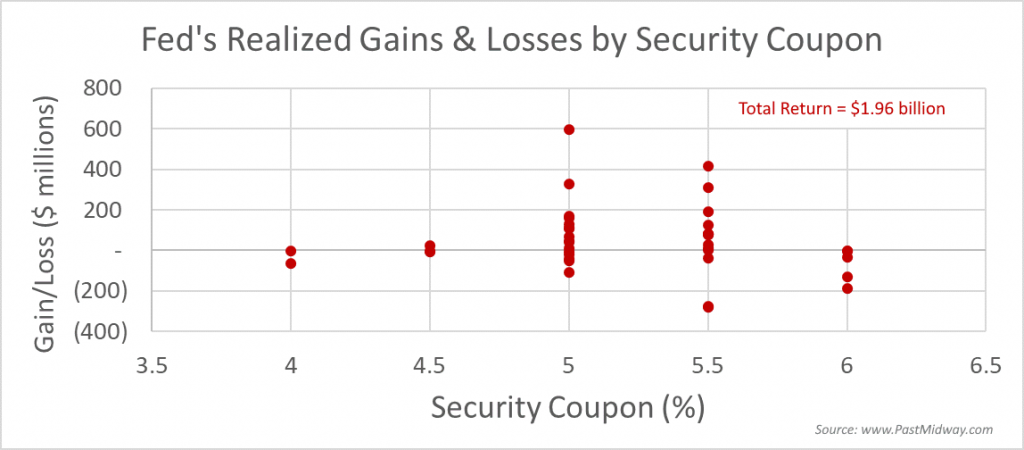
Let’s call it $2 billion profit, because what’s $40 million here and there.
$2 billion sounds like a lot of money, and it would be, if it were in your bank account. But before we get too excited, we should note this is only a 0.3% return from capital appreciation over 18 months.
Here’s the same chart but showing the gains/losses by percent return (excluding coupons).
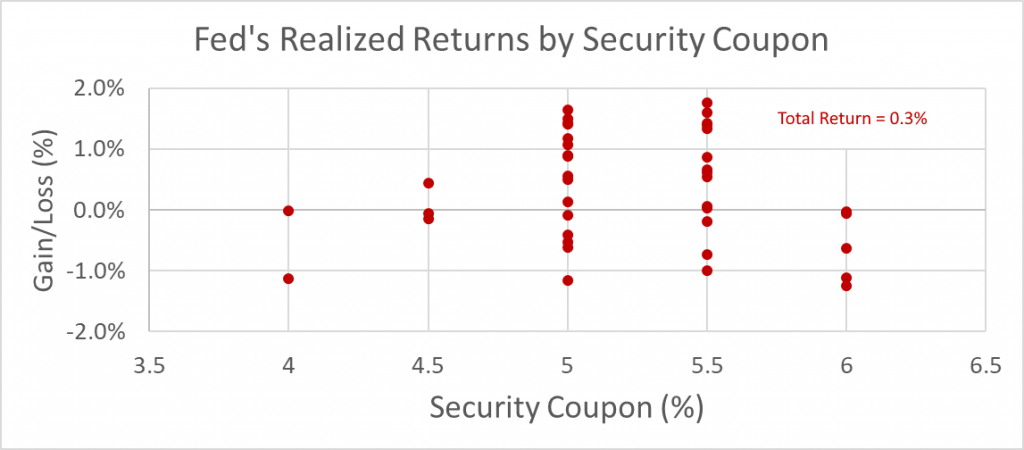
0.3% return over 18 months is not a great investment, but it’s also not a loss.
This is a significant point, because I expected to see net losses across the board as the outcome of this analysis.10
Most of the losses were from those mortgage-backed securities with the higher coupons (5.5% and 6.0%).
This stands to reason, because the mortgage-backed securities with higher interest rates presumably contained mortgages with a greater risk of default. That is, these baskets of mortgages either contained borrowers with lower credit scores or with less equity in the underlying assets, or both, or some combination such that these baskets required 0.5% – 1.0% higher rates to sell them initially.
It turns out, these are precisely the loans where the Fed lost more money (excluding coupon payments). The logical explanation – when the Fed sold these loans back to the market, they had higher rates of default and were therefore worth less.
Coupon Payments
Thus far, I have ignored the coupon payments in calculating the Fed’s return (assuming the Fed held the securities through coupon payment dates). I’ve intentionally left this out because that would exceed the time I was willing to put into the analysis. And, many of the positions bought and sold over the 18 month described above were done within the same month, sometimes just days apart.
As a side note to appease the finance experts, here is what the returns would have looked like if the Fed hypothetically kept these positions for 12 months on average, through a compete annual coupon payment. Essentially, this means adding 4.5%, 5.0%, 5.5% and 6.0% to each of the returns, respectively.
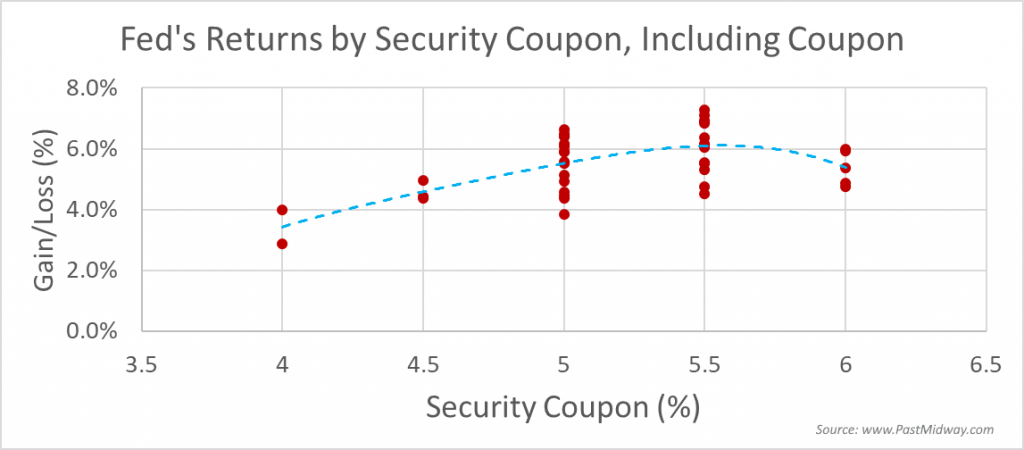
So, maybe instead of 0.3% return, the Fed might have made 5.5%. Again, I’m just surprised it wasn’t a complete catastrophic loss.11
Case Study & Some Corruption
The Fed purchased MBS from Primary Dealers (the big Banks). The primary reason given, as previously stated, was to move risky assets off the balance sheets of the large banks and onto the Fed’s (nearly unlimited) balance sheet.
As a case study, let’s look into the details of the Fed’s purchases and sales of one specific mortgage-backed security.12 Like I said, these securities have unique IDs, so we can follow and track the Fed’s buying and selling of one security as an example.
To limit pricing discrepancies due to timing, I only looked at transactions where the Fed either bought or sold this one security in March 2009 only. In other words, only one security traded over one month.
During March 2009, the Fed both purchased and sold this security to 10 different investment banks.
This is where things go a little sideways as I happened upon something that looks like corruption and fraud. I didn’t realize what I was about to stumble upon.
In tracking the back-and-forth transactions these banks made with the Fed, two questions arose in my mind:
QUESTION 1: If the Fed was bailing out the largest investment banks by purchasing their risky mortgage-backed securities, why were these same banks simultaneously buying the same securities from the Fed (sometimes just days apart), thereby putting them back on the bank’s balance sheets again?
I do not have a definitive answer to this question, but I would speculate the answer is “because it was profitable for the banks to do so.”
QUESTION 2: How is it ALL the banks purchased this same security from the Fed at a lower price than they sold the security to the Fed during the same month?
One might reasonably think some banks might come out ahead and some might come out behind, just due to the timing and various uncertainties. It would seem, statistically, the trades should generally average out. That is, the Fed would win some and lose some, but generally average to zero profit/loss on these round-trip trades, or something close to zero.
Instead, we see these 10 banks ALL netted a profit trading against the Fed, for this one security, during this one month. That seems statistically unlikely. (Again, ignoring the oddity that the banks were buying from the Fed at all… as the Fed was buying from them).
In terms of percentages, the profit might at first seem low, ranging from 0.94% for Morgan Stanley to 1.38% for UBS. But annualized, these returns would be 11.3% – 16.5%. Not bad.
But factoring in the amount traded, you get the profits for each bank, shown in the bar chart below.
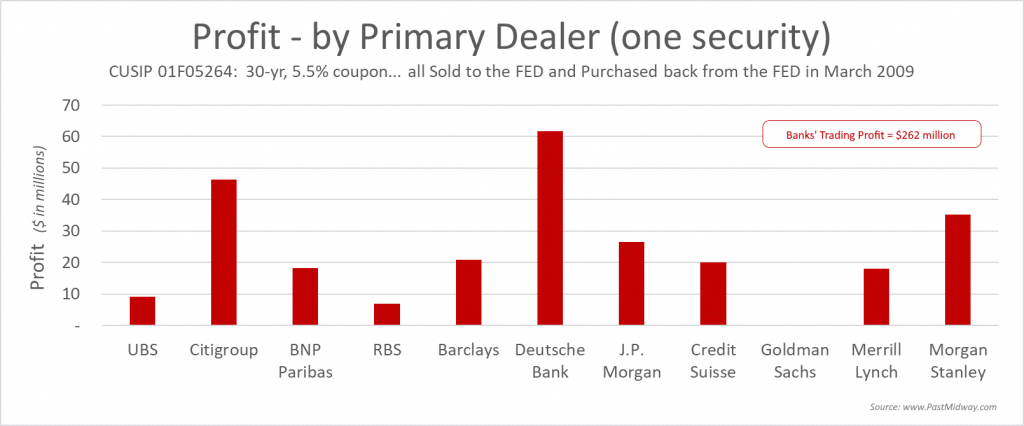
SCORE: Banks 10. Fed 0.
Even though UBS had the highest percent profit trading against the Fed, the reason UBS is not a tall bar on the chart above is because they only bought $666 million back from the Fed. This gave them a cool $9 million in profit.
Deutsche Bank made a 1.24% profit on its buybacks from the Fed (again, for only this one security for this one month), but Deutsche Bank bought back nearly $5 billion. This netted them ~$62 million in profit round trip. You can be sure the guys on that trading desk had fabulous year-end bonuses.
My analysis shows the big banks collectively profited $262 million trading this one security with the Fed as the counterparty during this one month.13 Sell high, buy low!
I should note that these round-trip sell-buyback transactions for this one specific security only represents 134 rows on my spreadsheet of 10,000+ rows. What might we find if we looked more in-depth at the other 10,000 transactions? My guess – we’d be appalled.
An Explanation
My understanding of the bailout was that the Fed would stabilize the economy and restore confidence by ensuring the big banks wouldn’t collapse. They did this by shifting the balance sheet risk of these questionable MBS from the banks to the Fed (the U.S. Federal Government). Said another way, the maneuver spread the risk to the American taxpayers, who would now be responsible for the outcome.
It appears the nimble fixed-income trading desks at these large investment banks saw this as a perfect opportunity to not only divest their risk for the firm, but to also trade against a slumbering goliath for an easy profit in the confusion. In doing so, the big banks made enormous profits. Individual Wall Street traders working the Fixed-Income desk surely enhanced their own personal wealth in the process as well, likely by tens of millions of dollars each, personally.
Maybe my conclusion is wrong. But that’s what the data imply. It’s also possible I made a mistake in my analysis. But which story would you most likely believe,
A) Andy had an error in his spreadsheet and therefore drew an incorrect conclusion about greed on Wall Street;14 or
B) The largest banks on Wall Street and the traders that worked there enhanced their corporate and personal wealth at the expense of the rest of us?
I’d bet on B).
Digging further, I managed to find a 2009 article by Seeking Alpha titled: Wall Street Investment Banks profit from trades with US Fed, which raised a red flag on this same idea. Key quotes:
“Wall Street banks are reaping outsized profits by trading with the US Federal Reserve, raising questions about whether the central bank is driving hard enough bargains in its dealings with private sector counterparties…”
“In the interests of transparency, [the Fed] often announces its intention to buy particular securities in advance. A former Fed official said this strategy enables banks to sell these securities to the Fed at an inflated price.”
“A former official of the US Treasury and the Fed said the situation had reached the point that ‘everyone games them. Their transparency hurts them. Everyone picks their pocket.’”
What about 2020?
If this happened in 2009 (and it did), what might we see if we probed into the 2020 stimulus?
According to Bloomberg, the big investment banks all had a stellar year on their fixed-income trading desks in the first half of 2020, reaping billions in profits.15 Here’s how three large banks’ fixed-income trading desks faired in the first half of 2020 compared to the first half of 2019. Impressive growth, for a global economic calamity.
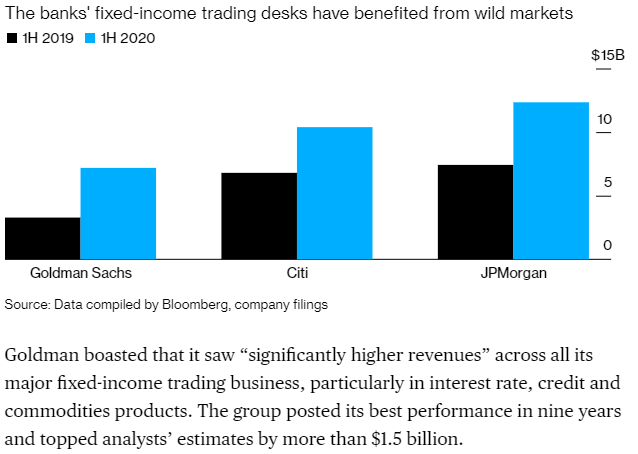
I think I’ll leave it at that and move on. By now, I’m sure you get the point.
Concluding Part 1
This is a good place to pause.
The key point to highlight here is, once the Fed stepped-in to bailout the banks and the overall economy in 2009+ with a massive stimulus (printing money), a precedent was set – an expectation even – to do this again in the future, as need may arise.
This is precisely what happened in 2019 and again in 2020. But on a whole new scale…
In Part 2, we’ll fast-forward to 2017-2019 when the Fed decided to start unwinding its remaining MBS positions purchased during the 2008-2009 recession.16
Spoiler – the Fed’s selling started crashing the market in September 2019, causing the Fed to reverse course and buy back. This was quite unsettling, although most people missed it. This also happened BEFORE Covid-19. The market was already teetering in Q3, just before an election year.17
That story up next…
Follow Past Midway if you would like an email notification of new posts.
FOOTNOTES:
- This was originally written as a single article. It’s much longer than anyone would want to read in one go, including me. So, I have broken this into a series of slightly more digestible bits. Maybe I’ll even finish the last part… if I get the sense there is general interest.
- Would it have actually imploded? We’ll never know. That experiment was not allowed to run.
- A personal story. When we purchased our house in 2005, there were loans called Stated Income Loans. To qualify for these mortgages, a borrower simply needed to “state” their expected income, without any proof. If someone knew they needed to make $100,000/year to qualify for the loan for the house they wanted, they just said, “I expect to make $100k this year.” Good enough. Stamp. Loan approved. The process was so divorced from reality, I wondered what kept people from just lying about their income on the application. The answer is: nothing. And this is precisely what happened. But how? Well, as long as everyone was making money, no one said anything. The borrowers got the house they wanted. The seller got a good price for the house. The mortgage lender got paid for generating the deal. The real estate agent and title company both got paid for closing on the home. The home inspectors and valuation experts had more customers than ever before. The banks made money repackaging these mortgages and reselling them on the secondary markets and by holding some of them on their own balance sheets. Investors placed money into real estate financing, presumably backed by hard assets appreciating in value. Who was going to complain?
- With its enormous infusion of capital in the financial system, the Fed suddenly expanded its stated role to include the following text (lifted from the Fed’s website): “From the end of 2008 through October 2014, the Federal Reserve greatly expanded its holding of longer-term securities through open market purchases with the goal of putting downward pressure on longer-term interest rates and thus supporting economic activity and job creation by making financial conditions more accommodative.” This is typical Fed speak.
- Source
- Source
- In layman’s terms, expansion of the Fed’s balance sheet, means more debt for the U.S. government (that is, more debt for the U.S. taxpayer). Apparently, “expansion” sounds better than “debt”. It has a more positive ring to it.
- A valid question is, “Might I have more interesting things to work on in my spare time?” Apparently not.
- These 10 positions represent 59% of the value of total exits over the period considered ($345 billion of the $620 billion sold).
- I should reiterate this is only a sample return for the positions sold. There could certainly be more toxicity in the remaining, unexamined positions. Likely, I would guess.
- Also, while it is tempting to try to draw conclusions about the financial theory of securitized assets by looking at the relative performance of these buckets, this would not be the correct data for this type of analysis, primarily because this only includes data for an 18-month window. To draw conclusions about the relative returns of different baskets, we would need a few decades of performance data (including defaults), which we don’t yet have (but it might be interesting).
- CUSIP = 01F05264 (this is the unique ID for this MBS basket).
- Note: Goldman Sachs shows as zero because, notably, they did not have a round-trip trade with the Fed on this security for the period considered.
- For the record, I wasn’t looking for this. I stumbled upon it accidentally as I was looking into one anomaly data point. In fact, I sat down to publish Part 1 today. Instead, I spent 6 additional hours on a Saturday morning with my head engrossed in a spreadsheet.
- Source for the graph
- The Fed called this effort of unwinding their positions “Balance Sheet Normalization”. This is partly why no one understands the Fed… because they coin convoluted phrases like this instead of saying “we sold some stuff”.
- This is also why (in part) I sold covered call options on much of our personal equity positions in December 2019 and bought substantial put options in February 2020.
Great article. Reminds me of the online game, Agar.io. The Fed is the gigantic blob-cell that skilled players try to bust up and eat. Large banks are the guys on the leader board. The uber tiny (beginner or novice) cells are the American people – i.e., you and me. The financial marketplace is the game platform, or “petri dish.” Alas, U.S. currency represents the food, “agar.” (NOTE: If Agar gets low, the Fed makes more. It must also eat.)
Strange things happen in this construct. Players with sufficient mass use (green) viruses to create more food. Depending on mass and timing, skilled players will cannibalize each other. They may also team-up and coordinate “mergers” and “acquisitions.” While these bigger and more significant plays unfold, countless tiny cells are randomly consumed with little thought. (It’s not personal; the two simply occupy the same spot at the same time at some point.) To ensure fairness, players who lose are allowed to “respawn.” However, they must start out very small. Experienced players refer to this process as “chumming.” Does that pretty much sum it up?
Funny analogy to agar.io… but not so far off really. Thanks for reading and commenting.
You mentioned about what did happen in terms of corruption, later, will you discuss if it can be regulated at all, and were these people (Players in the Fed and Banks) knowingly working together for profits? Love to hear your takes on the system motivations then and going forward.
[…] Part 1, I discussed the Fed’s massive financial intervention into the mortgage-backed security market […]