
This is Part 2 of my three-part series on the Federal Reserve.
Review
In Part 1, I discussed the Fed’s massive financial intervention into the mortgage-backed security market during the last recession (2008+). This event provides a good benchmark to compare subsequent Fed interventions, notably 2020.
I also analyzed the outcomes of the Fed’s mortgage-backed security purchases. Although I expected to see massive losses, I was surprised to discover the Fed came out profitable, at least for the transactions I sampled.
Lastly, while plowing through the Fed mortgage-backed security transaction data, I accidentally uncovered what appears to be unethical trading behavior on the part of some of the largest investment banks. These firms profited substantially trading against the Fed, while the Fed was simultaneously trying to bail them out. The trade data shows the Fed got fleeced.
Overview – Part 2
In Part 2, this part, we’ll discuss the subsequent Fed phases as they unfold from 2010 – 2019, leading up to 2020 (Part 3). These phases are grouped as follows:
- 2010 – 2014: The Fed continues its mortgage-backed security shopping spree, further increasing its balance sheet through January 2015, then leveling off.
- 2018 – 2019: The Fed tries to unload some mortgage-backed securities, selling them back to the market.
- September 2019: The market teeters from the sell-side pressure and begins to falter. Fearing a crash, the Fed suddenly reverses course and commits substantial resources to buy back much of what it just sold.
This was all BEFORE Covid-19.
In other words, the financial markets were already on shaky ground before 2020. In fact, this event sequence (especially the last point) illustrates how the Fed props up and continues to sustain the financial markets, even against the market’s natural, biological-like desire to reflect true value of the underlying assets. More on this point later, we’re still in the Overview, and clearly getting ahead of ourselves.
Let’s rewind to 2010 and pick up our storyline about the Fed and mortgage-backed securities…
2010 – 2014 – The Fed Continues Buying MBS
Most of us thought the dust of the last recession had settled by 2010-2011. The banks got bailed out. The auto industry got bailed out. The citizens (who qualified) received stimulus checks. That all happened, and we thought it was over. Once the financial world didn’t completely collapse, the news headlines shifted to more alarming topics, as they are prone to do.1
Consequently, most of us stopped following the Fed actions aimed at recovery. We either assumed the Fed was done with its intervention by 2010, or we were weary of all the recession-talk and just tuned out so we could worry about other things.
Meanwhile, after the initial surge of ~$1.2 trillion in MBS purchases in the first few months of the Fed’s intervention in 2008, the Fed quietly continued to inject another $2.1 trillion into the economy over the next 6 years, through the end of 2014.
At that point, the Fed halted its purchases, keeping its balance sheet relatively flat from 2015 to 2017 (actually, trending slightly downward as some MBS’s retired through pay-off or written-off as defaults).
Here’s what the Fed’s balance sheet looked like graphically over this period.
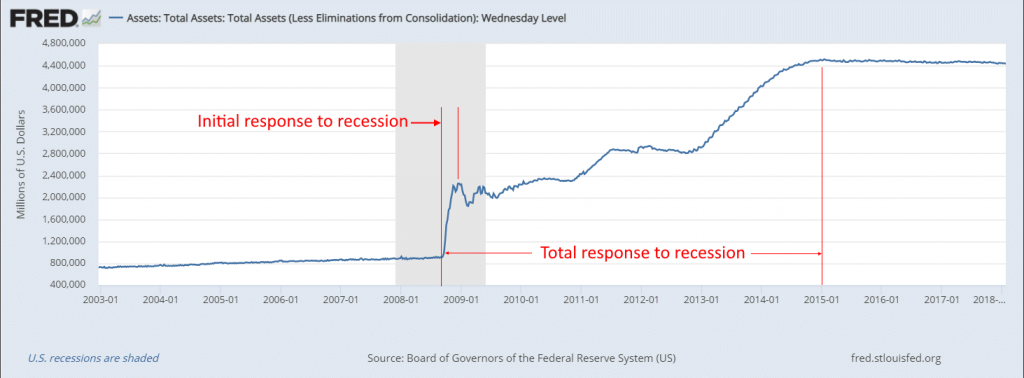
The Fed’s total response to the last recession was ~$3.3 trillion, over six years. To put this in context, the GDP of the United States in 2010 was ~$15 trillion. So, roughly,
The Fed injected ~22% of GDP, spread across six years.
This is a key point when we compare this size, scale & duration to the 2020-2021 stimulus, discussed in Part 3.
Aside – Fed Accounting
An increase in the Fed’s balance sheet simply means the Fed bought stuff and continues to hold it.
Changes to the Fed’s assets on its balance sheet is best understood by comparing it to your own personal finances.
Let’s say, hypothetically, you have $1,000 in the bank and nothing else. Your personal balance sheet would show $1,000 in assets, for the cash.
If you spend $50 on dinner, your cash goes down by $50 and you get some food in exchange. Assuming you intend to eat the food (and not resell it), this is just an expense. So, you had a nice meal, but your assets have decreased to $950, which is the cash left in the bank. You literally ate the other $50.
Let’s say you want to invest the remaining $950. You listen to Warren Buffet and buy SPY, the exchange-traded fund that tracks the S&P 500. Cool. Now the cash on your balance sheet is $0, but you have an offsetting $950 asset, the stock. In this case, your cash decreased by $950 and the other asset (the stock) increased by $950. Equal and opposite, so the total value of your assets didn’t change. You still have $950 worth of stuff. And, if you wanted, you could sell the stock and get your cash back.
In the world of personal finance, if you buy an asset, your cash decreases by the same amount as the asset is worth (we’ll assume no debt for this example). The asset and the cash offset each other so your total assets remain unchanged (unless the stock you bought changes in price over time, and hopefully it goes up. In fact, the Fed will likely help you with that).
Where your personal finance differs from the Fed, is that the Fed just prints cash it does not have to purchase assets.
For example, when the Fed purchases a mortgage-backed security, the value of that asset goes on the Fed’s balance sheet, but the cash does not go down to offset this, like it does for you and your family… because the Fed never had this cash to begin with. The Fed just pretends it has the cash to buy the mortgage-backed security. Consequently, the Fed’s balance sheet goes up when it makes a purchase (and down with a sale).
This is why the Fed’s balance sheet can change over time. It’s not necessarily because the assets it holds change in value, it’s that there is no offsetting change in cash for purchasing and selling stuff.
Some people try to do this exact same thing with their personal finances. They are called counterfeiters, to be precise, printing fake $20 dollar bills in their basement.2 This is a Federal offense, because we can’t just have people printing money out of thin air… the irony.3
End Aside
2018 – 2019 – The Fed Attempts to Unload
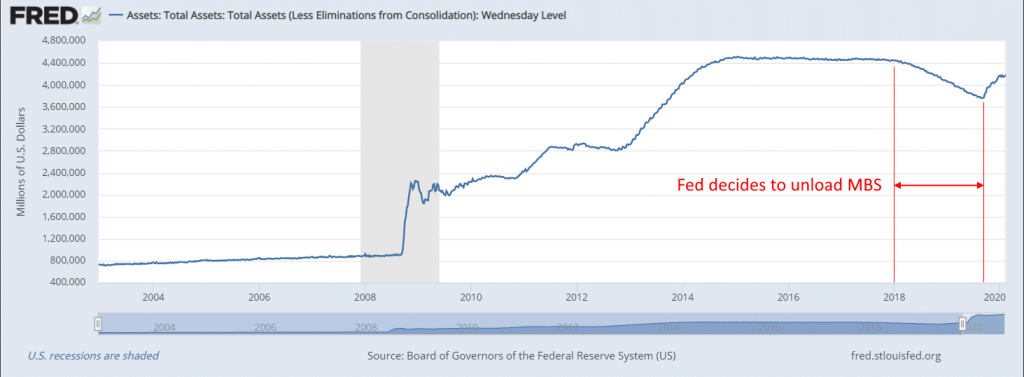
In late 2017, the Fed thought, “Hey, we’ve been holding these MBS’s for quite some time now. Maybe it’s time to reduce our bloated balance sheet and sell some of them”, which the Fed began in early 2018.
The graph below continues the curve from above, showing the Fed’s slow-and-steady balance sheet reduction.4
September 2019 – The Market Teetered from Sell-side Pressure
Even though the Fed tried to drip its holdings out slowly over time, the market didn’t have the appetite to absorb such an influx of assets, all on the sell-side. Here’s what the Fed had to say about this (their analysis in retrospect):
Strains in money market in September occurred against a backdrop of a declining level of reserves due to the Fed’s balance sheet normalization and heavy issuance of Treasury securities.
Federal Reserve: What Happened in Money Markets in September 2019?
As I mentioned in Part 1, “balance sheet normalization” is Fed-speak for “selling stuff” in an attempt to get back to “normal”. And “normal” means “like it used to be, when we held considerably fewer assets”.
Translation: The Fed was selling stuff while simultaneously (and incongruously, I might add) printing more money than normal.
Shorter version: “We messed up.”
By trying to sell a small portion of its balance sheet, the Fed created a supply/demand imbalance. It was simply too much on the sell-side. Consequently, the market began to falter and likely would/should have crashed in September 2019 (starting with the repo market)5 except the Fed saw the repercussions of its actions and immediately reversed course, buying back much of what it had just sold, essentially pumping the money right back into the market. This is clearly seen in the graph above – in the short-but-steep upward trajectory on the far right.
So, the Fed attempted a slow drawdown of its balance sheet by selling stuff, but then quickly had to repurchase to stave off impending calamity. This happened with little fanfare (for obvious reasons). Consequently, most people were unaware it occurred.
The sudden reversal in the Fed’s actions immediately dumped so much money into the economy, the stock market took off like a rocket in early 2020… not because it should have, but because there was such an enormous influx of capital flooding in from the Fed and trickling through the various asset classes (including equities).6
Around this same time, I was finalizing my economic thesis on a potential shock to the financial markets. I postulated that a significant incident in China could be a tipping point for the economy. On November 11, 2019, I published my thoughts in a blog titled Tariffs, Debt, Social Security & The Fed – an Economic Theory, where I argued the U.S. was in a very precarious position on too many economic fronts. We were fragile. Key excerpt:
If China experiences an economic shock due to political changes, like tariffs, or physical changes, like a significant natural disaster or viral outbreak, they may suddenly have a reduced interest in buying U.S. Treasuries.
Andy Jones – PastMidway.com (November 11, 2019)
I argued a trigger from China, coupled with our unhealthy, economic co-dependencies and our own internal economic fragility, could be the catalyst to set in motion a significant downturn. Given our precarious financial position, a small hiccup had the potential to produce a severe negative outcome.
And, well, this is precisely what happened. What I failed to anticipate was that the Fed would double down and balloon its balance sheet like never before. Because, apparently, markets are only meant to go up.
But now we are starting to discuss 2020 (intended for Part 3) and getting ahead of ourselves again. So, this is a good place to pause and end Part 2, with the setup for 2020.
Setup for 2020
We rolled in the 2020 New Year with a jittery market undercurrent, a bloated Fed balance sheet it can’t unwind,7 even after a decade, and a global pandemic looming on the horizon with few remaining viable options to combat it.
Next post, Part 3…
Follow Past Midway if you would like an email notification of new posts.
FOOTNOTES:
- Most notably: the devastating earthquake in Haiti, the massive volcano eruption in Iceland, the colossal oil spill in the Gulf of Mexico, the bailout of Greece by the EU, the rescue of the Chilean copper miners trapped underground for 69 days, the whole Wikileaks controversy, the Arab Spring, the 2nd largest nuclear accident in Japan, the death of Osama bin Laden, Occupy Wall Street and – getting just as much airtime as the rest of it – Lance Armstrong admitted to doping. So, there were plenty of crises to cover to ensure everyone experienced continual angst. Certainly, these topics were more eye-catching than whatever the Federal Reserve might be buying or not buying that week. Post-catastrophic-cataclysmic-financial-metldown-emergency-world, the Fed, and the economy at large, no longer sold network advertising.
- Interesting tidbit – counterfeit bills produced in the U.S. are usually the $20 denomination. Counterfeiters outside the U.S. don’t waste their time on $20’s. They prefer to print fake $100 bills. Efficient operation. Maybe we should outsource this.
- In case you are curious, the U.S. Department of Treasury estimates there are roughly $100 million in counterfeit dollars in circulation (~0.01% of total U.S. currency).
- Source: The Federal Reserve
- To be completely fair, there was a special confluence of several technical, timing factors at play here that contributed to the unfortunate timing for the Fed. Nevertheless, the Fed pushed the market down.
- Recall in January and February of 2020, the broad equities market was shooting up. The S&P 500 gained 5.3% in the first six weeks alone, starting the year strong… pre-covid.
- Technically, the Fed can unwind, it just didn’t like the market’s reaction. There’s a certain and distinct political aversion to a market crash going into an election year.
Do you believe the sell back by the Fed of MBS was the right move at the wrong rate of flow, or rather, a predicament that they would never really be able to off load so much?
It’s always easier to have an opinion after the fact. Without the benefit of hindsight, I’m not sure I would have done it differently than the Fed (on trying to sell assets to reduce the Fed balance sheet). It may be the Fed will have to hold these until maturity – 30 years at the longest, but typically much less because many people have refinanced with the super low rates recently.
My favorite part – lol
“Interesting tidbit – counterfeit bills produced in the U.S. are usually the $20 denomination. Counterfeiters outside the U.S. don’t waste their time on $20’s. They prefer to print fake $100 bills. Efficient operation. Maybe we should outsource this.”
That aside – great post as always – thanks for explaining things where the rest of us can understand it!
And thanks for reading and commenting on the nonsense I write. 🙂