
A footnote at the end of my last blog post suggested now may not be an ideal time to invest in the stock market. 50% of my readers1 asked for further elaboration on this point. What follows is undoubtedly more than requested.
Although the market is currently at an all-time high, that’s an insufficient rationale to avoid it. It is possible the economy will continue to expand, thus warranting higher equity valuations, perhaps for years or even decades. But if so, it will be against significant headwinds, based on the confluence of several political and economic factors that, in combination, amalgamate to negative outcomes. These factors and my overall economic thesis are summarized below.
Thesis Summary
- Tariffs on Chinese goods could trigger an increase in interest rates for U.S. Treasuries (thus inflation and a recession).
- The U.S. Debt load has garnered near unstoppable negative momentum and would be compounded by an increase in interest rates.
- Social Security concludes its final surplus year in 2019, applying further interest rate pressure on U.S. Treasuries.
- The Federal Reserve has considerably less maneuverability compared to 2008.
In the sections below, I argue the extreme importance of these factors on the macro economy and the potential negative feedback loop they might impose upon each other.
If these interactions are already clear, stop reading now and save yourself considerable time. In fact, I recommend it… because this likely the most boring thing I have ever written.2
Bottom Line – I see no other option but significant inflation on the horizon.
DISCLAIMERS
- I am not an economist. I also have no idea what I’m talking about, verified frequently. Consider this post just a thought exercise to imagine what mural we might paint on our economic wall, given the colors smeared on the palette in our collective hand.
- I am also not trying to make specific near-term predictions, just highlighting significant factors I believe could play a substantial role in the unfolding of our economic future. Certainly, the U.S. debt load and the issue with Social Security will need to be reconciled, but the exact timing is anyone’s guess.
- While I believe my economic logic below is sound, events can unfold that we could never predict, from bad (war, natural disaster, disease or an alien invasion), to good (revolutionary technological inventions… the next Internet or free energy3), or neutral (politicians change the rules and underlying assumptions). The point here is that any number of unexpected events might arise to completely nullify the flow of my arguments as presented below, especially the aliens.
Enough disclaimers. Let’s get started… don’t sue me.
1) Tariffs
Many products are manufactured in low-cost producing countries like China, Mexico, Vietnam, etc. This is an arbitrage of labor rates and currency exchange rates between countries and results in lower prices for U.S. consumers.
Tariffs are specifically designed to artificially increase the cost of certain foreign goods with the intention to influence the sourcing of that product. The thought is that tariffed products could become more price competitive to produce in the U.S. Politicians argue this creates U.S. jobs, especially in the manufacturing sector. And maybe it does, somewhat. In reality, the data suggests other countries are eager to manufacture these goods at advantageous pricing as well, compared to U.S. manufacturing.4
Many people are uncertain how tariffs are implemented, and rightly so. Much political rhetoric on this topic, especially as of late, is misguided or misleading. The most common misconception is that people think a tariff on Chinese goods means China writes a large check to the U.S. Treasury to pay the tariff bill. Not true. The U.S. buyer pays the tariff to the U.S. government upon importing the product. When a U.S. company or citizen remits money to the government, we typically call this a tax. Therefore,
A tariff is an additional tax the U.S. government levies on THE PURCHASER of certain foreign goods.
Trade Imbalances
China is a net exporter to the U.S., primarily for price reasons. I created the graph below using historical trade data from the United States Census Bureau. From this, we can see the trade imbalance with China is enormous. ~$420 billion in 2018 and ~$232 billion so far in 2019 (through August).
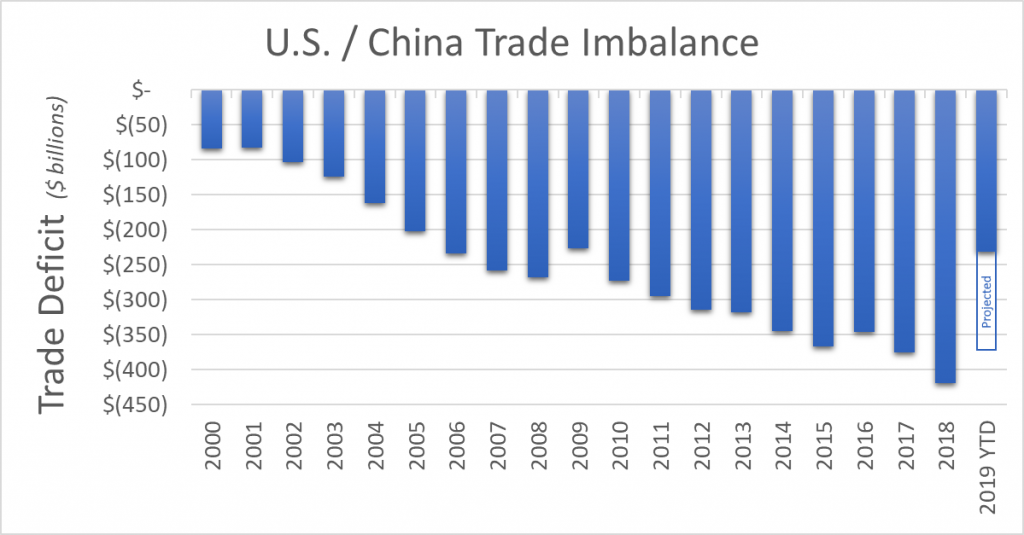
If this graph looks upside down, it’s because the numbers are negative. The U.S. has a trade deficit with China. In China, this same graph is flipped upright because China has an equal-but-opposite trade surplus with the U.S.
When Chinese goods are purchased in U.S. dollars, goods flow to the U.S. and dollars flow to China. This creates a trade imbalance between the two countries, which leaves China with an excess of U.S. dollars.5 The takeaway here is that China must do something with the $400 billion dollars (each year).
To repatriate these dollars, China must purchase assets in the U.S. such as real estate, businesses, or U.S. Treasuries.6 A significant part of China’s repatriation (and investment strategy) is to purchase U.S. Treasuries. As such, China is a major purchaser of U.S. debt.
In fact, China is currently the largest foreign owner of U.S. debt,7 holding $1.11 trillion in U.S. Treasuries (~5% of the U.S. debt on the balance sheet). To put this in perspective, the Federal Reserve purchased $2 trillion in Treasury notes between 2007 and 2014 as part of its massive effort to stimulate the economy during the last recession.
The simplified way to think about this is that the U.S. government says, “Hey, we’d like to borrow those dollars you have so we can spend it on government-y things. We’ll pay interest.”
China says, “Yeah sure, because we have a lot of dollars laying around… and interest sounds great. And we like the idea of propping up the value of the dollar, so the U.S. continues to import goods from China with a strong currency.”
So, the countries swap. The U.S. gets the dollars back from China to spend on government programs and China gets an IOU note from the U.S. (a Treasury note) – a promise to repay with interest, over time.
When the exchange happens – the repatriation of dollars from China in the form of purchasing U.S. debt – it creates a significant additional demand for U.S. Treasuries. This is a key point.
Demand Lowers Treasury Rates
With higher demand, interest rates (yield) offered on Treasuries can be quite low… because the U.S. government does not need to entice more buyers of debt by offering a higher yield. China (and other countries) purchasing Treasuries to repatriate their dollars from trade imbalances adds to the demand and helps keep yields low. Consequently, the U.S. can borrow money at very low interest rates. How fortunate.
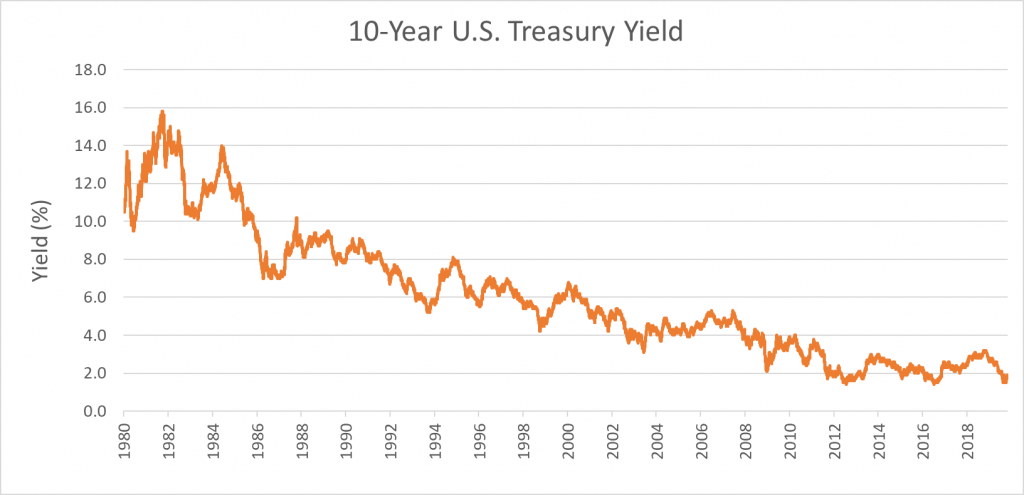
The graph below shows the trend of the 10-year U.S. Treasury yield over time since 1980. 10-year U.S. Treasury Notes are the most liquid, most traded bond in the world. They are also the benchmark used to set U.S. home mortgage rates.8
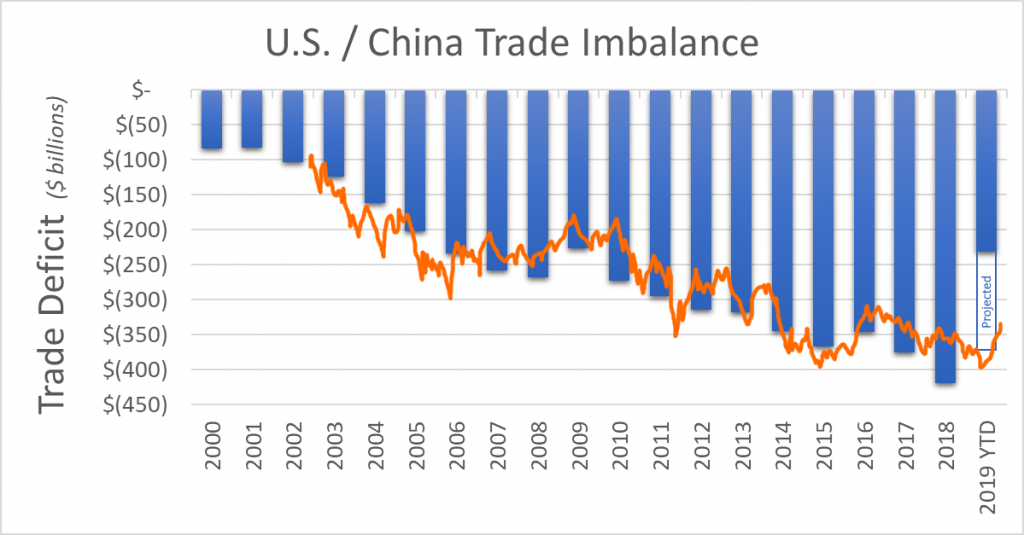
Looking at the same data, but only from 2000 to 2019 YTD…
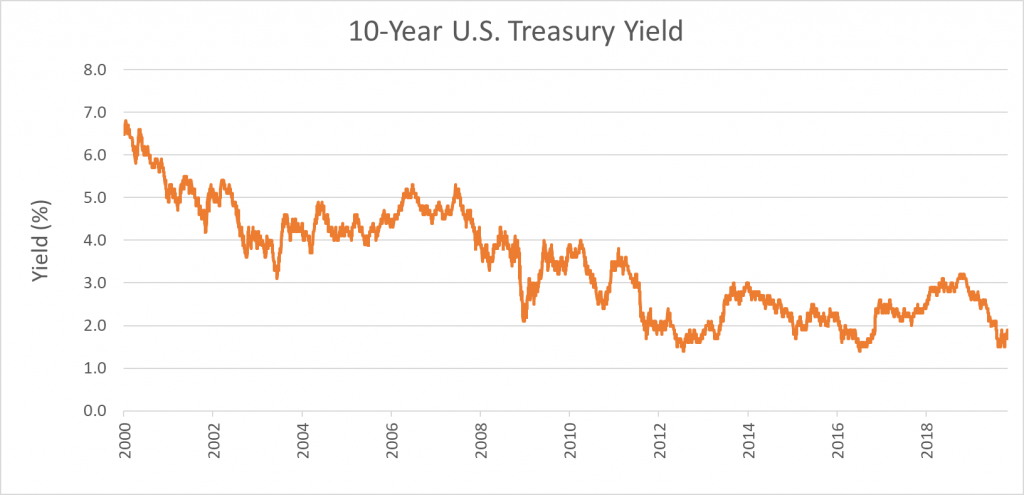
If you overlay this graph with the trade deficit with China graph from above (and shift the timing a bit to account for a lag between the trade imbalance and the purchase of Treasuries), you can see a strong positive correlation9 as they trend downward together, nearly lock-step.
Why Is This Important?
Any number of things can persuade China to shift its policy for the repatriation of U.S. dollars. If China experiences an economic shock due to political changes, like tariffs,10 they may suddenly have a reduced interest in buying U.S. Treasuries. Or China might simply shift its investment policy on how to repatriate the dollars, electing to purchase other U.S. asset classes instead of Treasuries. In either case, the net effect is less demand for Treasuries. Lower demand translates into the need to offer a higher yield to attract enough investment dollars to raise the required capital to run the U.S. government.11
Why Significant Tariffs on Chinese Goods May Tank The U.S. Economy – the Cycle Summarized
- If tariffs on Chinese goods incentivize U.S. businesses and consumers to source products from non-China locations, including producing some goods in the U.S., China will export fewer goods to the U.S.
- Consequently, fewer dollars will arrive in China.
- Fewer dollars in China leads to lower demand for U.S. Treasuries.
- Lower demand for U.S. Treasuries requires higher interest rates offered for U.S. Treasuries to attract buyers of the debt.
- Higher interest rates translate into…
- More money spent servicing the interest payments on Federal debt, reducing the funds available for other governmental programs.
- More expensive debt capital for investment purposes (business loans), slowing economic growth.
- Higher mortgage interest rates, resulting in fewer discretionary spending dollars for consumers, slowing the economy.
- The economy softens, a potential recession looms and a negative feedback loop begins…
- With national debt already at 103% of GDP,12 people become increasingly concerned about the viability of the U.S. government to fulfill its debt obligations.
- With lower confidence, credit risk increases.
- With higher credit risk, there must be a corresponding increase in interest rates to attract and entice investors to accept the additional perceived default risk.
- Higher rates… go back to point #5 and complete the loop.
- Lower demand for U.S. Treasuries also puts downward pressure on the dollar. If the dollar declines in value, relative to other currencies, the foreign holders of U.S. dollars (like China) will have less incentive to purchase U.S. Treasuries, because they will be getting paid back in a currency that is worth less than it used to be (relative to their home currency value). This creates a lower demand for Treasuries as well. Go back to step 4 and repeat the cycle again.
- A lower dollar translates into more expensive goods (in dollar terms). This is called inflation, which seems inevitable at this point, given our debt load, but more about this in the Debt section below.
The Bottom Line on Tariffs
Tariffs are promoted politically as a show of power toward our largest trading partner. The political rhetoric is that we will benefit from strong-arming the Chinese to remit money to us. The reality is, these new tariffs on select Chinese goods are simply a new tax on U.S. citizens/businesses and might trigger inflation, unwanted higher interest rates on our national debt and potentially a recession.
A higher interest rate on U.S. debt would be manageable, except the U.S. has so much debt. This leads us to my 2nd point.
2) U.S. Debt
It’s enormous.
The U.S. government holds a mountain of debt, $23.0 trillion as of early November 2019, to be exact.13 This debt reported on the U.S. balance sheet includes debt held by the public and intragovernmental debt and is created when the U.S. government sells Treasury bills, notes and bonds14 (mostly notes) plus other securities.
Sometimes these debt securities are sold to the public (you can buy them through your bank or broker) and sometimes they are sold to other departments of the U.S. government – the biggest being the Social Security Trust Fund (which holds 51% of the intragovernmental debt).15
Purpose of Debt
The U.S. government creates debt securities for two purposes:
- To have money to spend for its operating budget
- To create a mechanism to house funds for those government programs, like Social Security, that have excess funds and are required by law to invest those excess funds into U.S. Treasuries.
To get an idea of scale, I did a little math:
- In 1971, the year I was born, the U.S. had $398 billion in debt and a population of 207 million people. This equates to ~$1,900 in debt per citizen. Adjusting for inflation to 2019 dollars, this is about $12,000 per citizen.
- In 2019, the U.S. has $23.0 trillion in debt and 327 million citizens. This equates to ~$70,000 in debt per citizen. This is nearly a 6x increase in debt per citizen over my lifetime alone!16
How Does This Compare to Other Countries?
When the numbers are so large, it can be difficult to grasp the scale. $23 trillion is a lot, but the U.S. is also large economy. How significant is this?
One way to help understand the relative magnitude is to compare the U.S. debt load to that of other countries, normalized by the GDP. The chart below shows the national debt of various countries. I have highlighted the U.S. in blue.
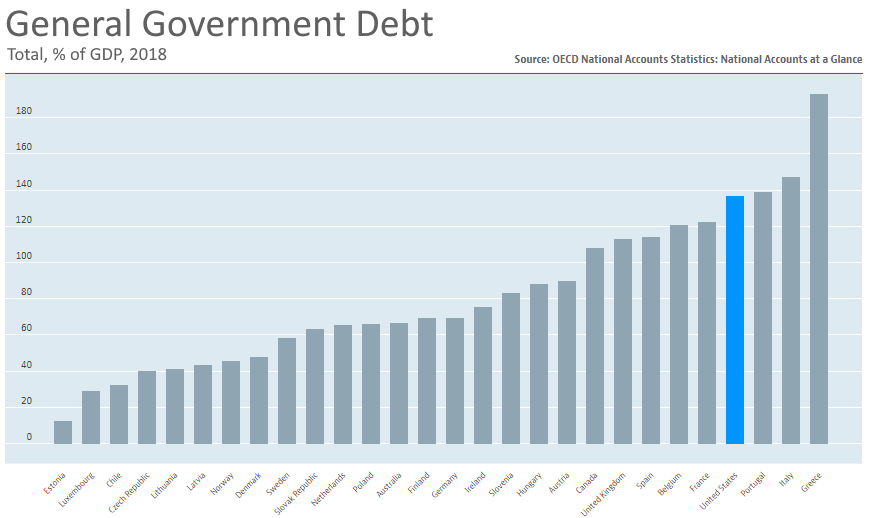
Notice the company we keep in this chart, right next to Portugal and Italy. Not quite Greece, but worse than Spain. Recall that Portugal, Italy, Spain and Greece created a lot of economic turmoil in the EU in recent years for their inability to service their debt.
Two points:
- A key benefit of being an enormous economy with the global default currency is that the U.S. has access to lower interest rates. Given its sheer size, the U.S. has a privileged investor status, at least for now. But that doesn’t necessarily have to be the case into perpetuity.
- A high debt load is only part of the story. The ability to service that debt is arguably more important.
Ability to Service the Debt
The U.S. is projected to receive tax revenue in 2019 of $3.44 trillion – about 15% of GDP. If we think about this level of income, debt and corresponding interest expense at the family household level, maybe it isn’t so bad. Let’s have a look from the perspective of a more familiar scenario – buying a home.
A More Relatable Example
Let’s say a family has an annual income of $100,000 and would like to get a mortgage that corresponds to the borrowing level of the U.S. government. The equivalent amount to borrow would be $668,000. On a $100,000 income, that seems a bit much. But, to be fair in our comparison, let’s also assume the family has a privileged borrowing status and can therefore get the same debt terms as the U.S. government… specifically, a 2.5% interest-only loan.17 No principle payments. That loan requires $16,700/year in interest payments ($1,392 per month). When we put it like that, it seems plausible, reasonable even.
This debt load is within the means of the family with their current income, as long as interest rates remain low. The key difference is, the family has borrowed to acquire a house, so their debt is backed by a tangible asset with real value, probably in excess of the mortgage and the home is generally expected to appreciate over time.
U.S. government debt is also backed by an asset – an intangible asset (mostly) – the belief that the U.S. economy is robust and somehow too big to fail. If interest rates remain low, the U.S. government can certainly service debt of this magnitude, especially in a growing economy.
But what if interest rates increase, as they might from lower investor demand in Treasuries, spurred by tariffs (discussed above) and a shift in the investment activities of the Social Security Trust Fund (discussed below in point #3)?
Interest Obligations
Net interest payments on government debt currently amount to 8.7% of U.S. government spending (2019 estimate), as seen in the graph below.
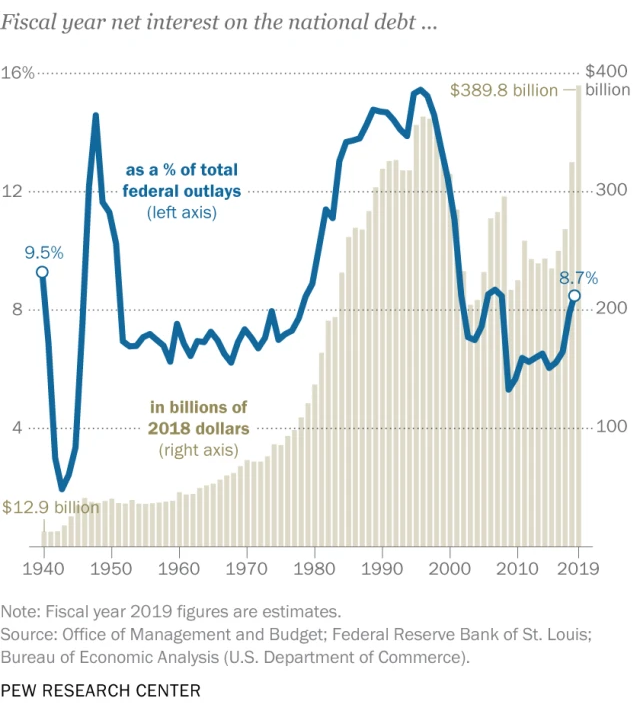
Given the current low interest rates the government pays on Treasuries (currently averaging 2.5%), the interest payments are somewhat manageable (as previously mentioned). But what happens if interest rates climb back up to more “normal” historical rates… or worse, rates like those in the 1980’s?
Pessimistic View
Let’s explore an interest rate climb to the rates paid in the 1980’s… peaking at 15.8%.18 This would require interest payments of about 6.5 times more than the current interest expense. Even assuming the debt does NOT increase further (optimistic) and that GDP at least maintains its current level, more than 57% of the federal budget would be consumed on interest payments alone. Clearly, this is not workable.
In fact, even if the average interest rate only doubles from 2.5% to 5%, the U.S. would need to pay 17.4% of its budget toward interest payments alone. This is higher than any historical point on the chart above, going back to 1940.
Deficit Spending
There are limits to the amount of debt a country can bear, even with a growing economy and low interest rates. However, the U.S. continues to ramp up deficit spending, overspending its income (from tax revenues) by 6% in 2018. Deficit spending adds to the total debt of a nation.
Here again, it is also useful to see how the U.S. deficit compares to other nations. The chart below shows government deficit spending by various countries, normalized by GDP. Again, I highlighted the U.S. in blue.
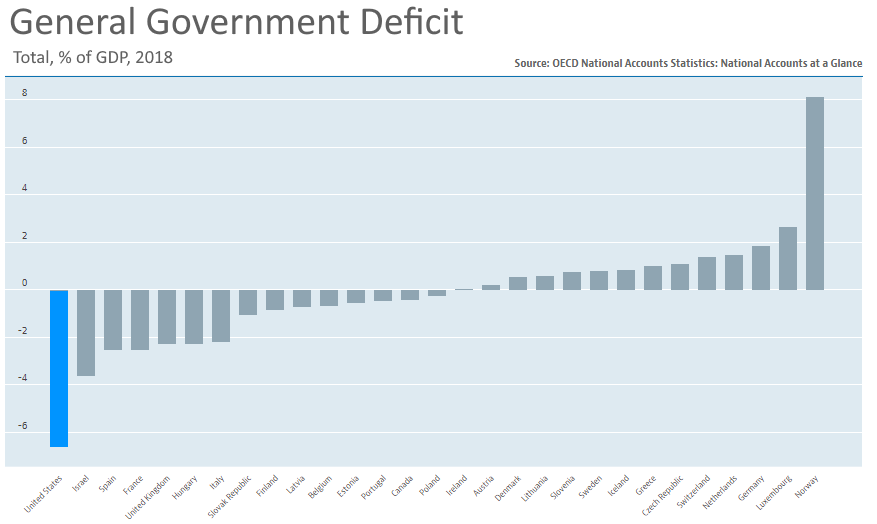
Last place.
Debt Conclusion
When we compare the U.S. debt position relative to a family’s budget, it seems manageable, but only if interest rates remain low. If this hypothetical family borrowed using a floating rate mortgage, they would be living trepidatiously regarding their future budget. The same is true with the debt position of the U.S. government.
When we compare the U.S. debt relative to other countries, it’s immediately apparent the U.S. is in a precarious position, except for the favored investor status it enjoys for being so large.
When we compare the U.S. deficit spending relative to other countries, there is no comparison. The U.S. outspends by a significant margin.
All of these comparisons point to the obvious conclusion – the U.S. is significantly in over its head in debt and growing substantially worse with time.
We are approaching the breaking point on our debt load.
Lest we conclude that the $23 trillion is manageable… by crossing our fingers and hoping interest rates stay low… there’s more… an enormous monster lurking under the bed that no one wants to see… off-balance sheet debt.
Off-Balance-Sheet Debt
While $23 trillion debt on the balance sheet sounds like an astronomical amount of money, it’s small compared to the off-balance-sheet debt held by the U.S. government, which is estimated to be another $70 trillion.
Wait… what?!? There’s additional debt that we don’t count?
Yes.
The debt counted on the balance sheet includes the IOU notes (Treasuries) the U.S. government has issued, to the public, foreign nations and to other government branches (like Social Security). But, in addition, the U.S. government has promised certain entitlements (Social Security benefits, Disability benefits, Medicare, Military Retirement, etc.) and has backed guarantees behind other programs like housing mortgages (Fannie Mae, Freddie Mac – nationalize during the financial crisis), Student Loan Guarantees, and FDIC insurance for bank deposits. Of these, Social Security and Medicare represent the largest obligations, (approximately $20 trillion each).19
While on-balance sheet items will drive near-term economic analysis, off-balance-sheet debt will almost certainly get us in the end, starting with Social Security.
We’ve heard for decades how the Social Security program is under-funded relative to the obligations the retiring baby boomer generation will create. This is no secret, but it apparently seemed too far in the future to be concerned about it at the time.20 But now, the future is here.
This brings us to the 3rd point… Social Security.
3) Social Security
As you might imagine, the Social Security program deals in large numbers. Enormous amounts of money. Because of this, we might expect this organization to be large as well. And it is, but you might be surprised at the scale.21
There are roughly 67,500 employees working for the Social Security Administration across ~1,200 offices. That seems like a lot, until you consider the load of inbound requests to the administration:
- 170,000 people visit a Social Security office… every day!
- The Program receives 250,000 incoming phones calls… Every. Single. Day.
Incredible.
With all these Federal and State employees processing this unfathomable number of inbound requests, one might wonder if the Social Security Administration runs efficiently. It is, after all, a government program.
As far as I can tell, as an organization, the Social Security Administration appears impressively efficient. Administrative expenses run about 1.4% of the budget (technically, this is a percentage of the payout). Can you think of any charitable organization that runs that lean? No way.
While the Social Security Administration has an enormous financial obstacle in front of it, that’s not the fault of the Social Security Administration itself due to wastefulness. It is the fault of lawmakers who have dealt a lousy hand the Social Security Administration must play. The Administration does not make the rules, they just follow them, efficiently… and frequently raise a red flag in their annual report about the disparity between income and expenses for the Program. The math does not compute. Apparently, these red flags are not sufficient to invoke change from lawmakers.
Social Security’s Problems
There are two components of the Social Security Program that factor into the macro-economic conundrum, which forms the basis for point #3 in my overall economic thesis:
A) The shortfall of Social Security starting in 2020.
B) The huge unfunded liability (the off-balance sheet liability previous mentioned).
Let’s discuss each in turn.
A) Social Security Shortfall
For years, the social security program has collected money in excess of its annual outflow. When this happens, the Social Security Administration can’t just stuff the money under a mattress and wait until the cash is needed.
Rather than stockpile loads of cash, the Administration is required by law to purchase U.S. Treasury Notes with its excess capital. This way, the money earns a little interest and the U.S. government has another capital pool from which to borrow.
The U.S. government then borrows and spends these excess Social Security funds on government operations. The Social Security Trust Fund, in return, gets an IOU note from the government (the Treasury bond), to be paid at some future date. As of 2019, Social Security held about $2.9 trillion in government debt itself.
In addition to the repatriation of U.S. dollars from trade imbalances discussed in point #1,
the Social Security Fund has historically been a net purchaser of U.S. Treasuries, also helping increase demand (and lowering rates).
At some point in the future, the Social Security Program is expected to run a negative cash flow. That point is 2020. This used to seem like the distant future, to be concerned about later.
No worries. The Social Security Trust Fund has been saving for this, right? We simply have to tap into the reserve money to make up the delta. That is why the Social Security Trust fund is there, holding all those Treasury notes, right?22
How much is in the coffers?
The Trust Fund currently holds nearly $3 trillion dollars, about 33 months of funds in reserve.
This means the Social Security Program could continue to pay its current level of benefits for 33 months, even if its income from tax revenue went to zero. 33 months isn’t so long, which is why the Social Security program is called a “Pay-As-You-Go Financing” program.
With Social Security, tax revenue for the current year is deployed to that year’s payout obligations. Beginning in 2020, unless there is a policy change, the Social Security Trust Fund will dip into its reserves to meet its promised payout obligations.
So, starting in 2020, we will have to payout more than we collect… but we do have this $3 trillion buffer in the trust fund. Won’t that cover it?
Well, for a while… but ultimately, no.
Baby Boomer Effect on Social Security
When the baby boomers retire, as they are now, there will be a growing need for the promised Social Security funds to pay the people who have been promised this benefit. With this deficit starting in 2020, Social Security will transition from a net buyer of Treasuries to a net seller of Treasuries.
Another factor lowering demand for Treasuries.
If the U.S. government pays the Social Security Administration cash for redeeming Treasury Notes, the government will need to increase its borrowing. That is, it will need to issue more Treasury notes.
Higher production of Treasuries.
With (1) lower demand and (2) higher production, Treasury prices should push lower. Said another way, interest rates on Treasuries will increase. An increase in rates means higher future interest payments… on a larger and larger debt.
This brings us to the conversation about the unfunded liability part of Social Security.
B) Unfunded Liability
The Social Security Administration projects future income from tax revenues minus future obligations (payouts to recipients) out 75 years. The Administration then discounts these cash flows to present value.
In a perfect world, the present value of these projections would be exactly $0. This means collections and expenditures are equal for the 75-year forecast period. Well, we can’t expect it to be exact, that might be cutting it a bit close.
So, what is the present value of these projections?
ANSWER: $16 trillion.
INTERPRETATION: in order to fund the future payout obligations (as promised today), the Trust Fund should have a $16 trillion balance already. Instead, it has $3 trillion (almost).
Further, starting in 2020, the trust fund will begin to decline, not grow. Worse, every year in the 75-year projection periods shows a shortfall (between collections and payout obligations).
Here’s the relevant quote from the Social Security annual report:
Social Security’s financing is not projected to be sustainable over the long term with the tax rates and benefit levels scheduled in current law. Program costs will exceed noninterest income in all years of the 75-year projection period. In 2034, the [Trust Fund] asset reserves will be depleted according to the projections by the Social Security’s Trustees.
This is the red flag that the Social Security Administration is waving to no avail.
They go on to say that the Social Security Administration could fund future obligations up to 74%, given current assumptions.
But the plot thickens…
We’ve Waited Too Long
As of year-end 2018, the discounted cash flow projections showed we needed an additional $16 trillion. But in 2017, we only needed $15 trillion. In 2016, we were only short $14 trillion. The Fund is short about an additional $1 trillion each year.
At the end of 2019, the Fund might project a need of $17 trillion, but still only has a little less than $3 trillion.
The longer lawmakers wait to address the Social Security debacle, the worse the problem becomes and the more difficult it is to solve.
The Scale of the Problem
The Social Security Program’s “Total Financing Sources” in 2018 was $1.041 trillion.
If the program is taking in ~$1 trillion and is roughly $1 trillion short each year lately, does this mean the Program takes in about half of what it should to fund future payout obligations. Yes… it would seem so, plus the $16 trillion deficit it has to make up as well.
But wait, the annual tax receipts for the entire U.S. Federal Government is only $3.3 trillion. This doesn’t add up. And that is precisely my point.
To make Social Security whole, requires too large of a percentage of the overall Federal budget.
Logical Conclusion
The only way I see out of this huge unfunded liability (without severely cutting back on entitlements and without a crippling tax increase) is inflation. Inflation makes the debt look smaller in future dollars.
Rising interest rates from the Treasuries will likely spur inflation naturally. This not only helps with the Social Security shortfall, it helps with the national debt (as we inflate out of it). But it definitely does not help equity valuations.23
It’s also unfortunate to be retired in high inflationary times (because your salary no longer goes up each year).
What Solutions are Being Considered for Social Security?
The following four ideas are presented by the Social Security Administration in their annual report.
- Increasing payroll taxes
- Slowing the growth in benefits
- Finding other revenue sources
- Increasing expected returns by investing the Trust Fund asset reserves, at least in part, in private securities.
Whoa… what! The last one doesn’t even make sense. Let’s delve into that a bit.
Social Security Funds Investing in the Market
First, if the reserve is expected to be depleted by 2034, this doesn’t help that much. What would they invest? 14 years is maybe not a long enough time horizon to be investing in the market.
Second, for the sake of argument, let’s do the math and consider potential consequences.
Let’s suppose Social Security can get an extra 5% return from its reserve funds with a riskier investment strategy compared to Treasuries. Let’s further suppose they allow 33% of the Trust Fund to invest in equities.
$1 trillion invested with an extra 5% gain equals an additional $50 billion per year.
$50 billion = $0.05 trillion.
So, the Fund might get an extra $0.05 trillion per year but needs to make up a $16 trillion gap. Doesn’t sound so promising. Just a drop in the bucket.
Third, what might this do to pricing in the financial markets?
$1 trillion flowing into the market, all on the buy-side. It is obviously difficult to quantify the upward pressure this inflow of funds might put on the market, but it would be significant, I would guess.
What if the inflow of investment dollars into the market pushes equity prices higher? That is, Social Security, by infusing such a large amount of money into the market, actually moves the market (as I would expect $1 trillion would do) and thus ends up as a buyer (in the latter part of the year) at higher prices… partly of their own doing. The Funds would be making the classic mistake of buying at the high.
Once these funds are fully invested and the market has digested and balanced the demand, the demand reduces (keep in mind, Social Security needs these funds in the fairly near-future to pay obligations, thus steadily depleting the Fund). This draw down of $1 trillion from the market, over time, will surely move the market the other direction, and Social Security would make the classic mistake of selling at a low.
Buy high. Sell Low.
What if, in the meantime, the U.S. experiences a recession (perhaps from Chinese tariffs and the overall debt load). What if, in trying to grow the Trust Fund some incremental amount, the Administration actually loses a significant portion of the existing reserves? The irony.24
Recessionary talk brings us to my next point, about the Federal Reserve.
4) The Federal Reserve
The Federal Reserve has the magical ability to add and subtract money from the economy. Mostly add. They do this by buying and selling Treasuries.
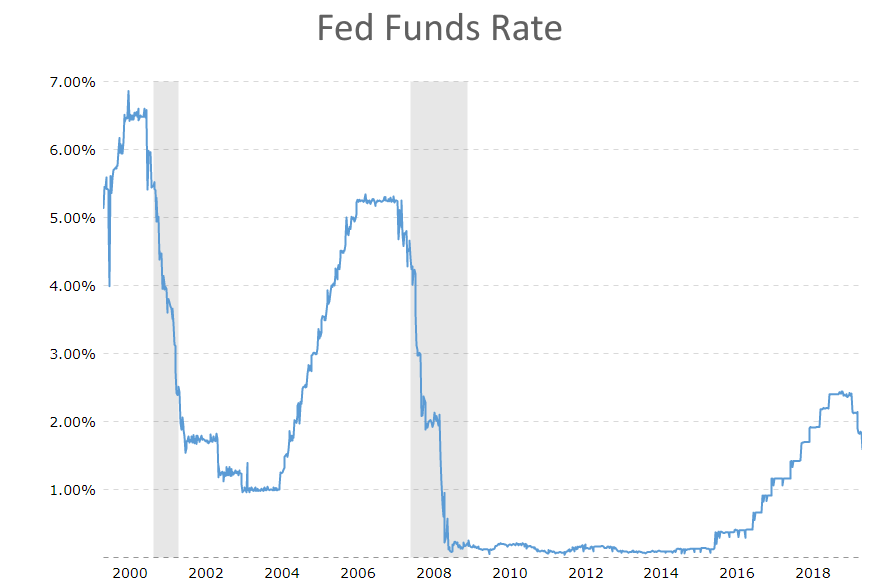
In July 2007, just before the last recession, the Fed Funds rate was 5.25%. That gave the Fed some wiggle room to inject capital into the economy, which it did… in a massive way as the recession hit. The Fed dropped the rate from 5.25% to 0.08% (effectively zero) by December 2008.
Similarly, in 2001, with the dotcom bust and subsequent recession, the Fed Funds rate was about 6.5%. To combat the recession, the Fed dropped the rate to 1.0% by 2003.
In both previous recessions, the Fed had about 5% drop in which to work.
By comparison, federal funds rate is currently 1.58% (end of October 2019). Not much room to go down from here.
The chart below shows the Fed Funds rate over time, since the year 2000.
A decline in the Fed funds rate generally has a positive effect on the market. Cheaper money translates into further economic expansion, so the thinking goes. And, all things being equal, I suppose it should.
When borrowing is cheap, it encourages companies to invest, homeowners to purchase (thus driving up real estate prices), builders to build with low interest rate burdens. If companies spend less on interest expense, more capital is available to increase salaries for employees, giving them more spending power and boosting the economy. In short, cheap capital produces cycles of economic expansion. For this reason,
THE major economic force for the past decades has been access to inexpensive money.
However, if capital is artificially cheap, which I argue it has been (through the Fed printing money), the pace of acceleration exceeds the economy’s natural organic desire for growth. This inevitably leads to boom and bust cycles. You just can’t force the economy to outpace itself forever.
The Fed can only print so much money before inflation is inevitable.
Further, one might wonder what data the Fed is reviewing that makes it think it should start lowering rates now, as it has done recently (see chart above). Shouldn’t a rate reduction signal the Fed is seeing something concerning in their forward-looking data?
This has been a lot to digest, so let’s recap.
Recap
The trade war with China leads to tariffs on certain goods, resulting in some of China’s products become more expensive in the U.S. The U.S. then sources these products from elsewhere (including domestic production). China now has fewer dollars to repatriate. China therefore purchases fewer Treasury notes. Less demand for Treasuries requires a lower price, and thus a higher yield. The 10-year Treasury note yield increases to attract investors. The higher yield increases the interest payment on National Debt. The higher interest payments increase the deficit and accelerate the pace of U.S. accumulation of debt.
Meanwhile, Social Security begins to run a deficit and transitions from a net buyer of Treasuries to a net seller. This also lowers the demand for Treasuries, applying pressure for higher rates still.
The debt begins to look out of control. Recession looms. To combat this, the Fed prints more money, but it can only do so much this time around because rates are already low.
This all points to inflation. It’s the only logical conclusion I can draw from this thought process and really, the only viable way out of an incredible debt load. Significant inflation.
Or maybe not… maybe we can sustain this level of crazy debt and more for 20+ years. Who knows?
Bonus – Effects of Repatriation of Corporate Overseas Profits
In addition to the four points discussed, the stock market has also been encouraged by the one-time positive impact of the Repatriation of offshore corporate profits, which were primarily used for stock buybacks. My guess is the impact of this buoying effect is nearing its completion. I won’t elaborate further on this point here, relinquishing this to a future post, but the bottom line is that I think this boost of funds entering the market has sustained an upward trend as of late, especially for the price of larger, multinational companies.
Conclusion
My thesis here is really all about a tipping point, especially as it relates to the impact of potentially higher Treasury rates. Maybe the tipping point is a trade war with China. Maybe the tipping point is Social Security transitioning to a deficit. Or both.
Social Security’s performance is a given in the near-term. We have a good understanding of how that will play out economically, at least for a 12-24 month horizon. But the trade war with China is more uncertain. If it settles down and does not fully materialize, will all of this just go away?
Short answer… no.
The national debt is still a loaded weapon, but maybe the finger is off the trigger for a while… and we can live in economic bliss once again, for a season. But, at some point, the national debt, especially the unfunded liabilities, will require a great reckoning.
P.S. Follow Past Midway if you would like an email notification of new posts.
FOOTNOTES:
- Two people.
- I found myself avidly reading the Social Security’s annual audit report with great interest after midnight one evening. The phrase “Get a life” comes to mind. That said, every economic statistic I cite is direct from source documents. My research is painstakingly thorough here.
- Although, one might argue that free energy could destabilize the world as oil-rich economies find their income source go to zero. This severe alteration in global economics would surely have political fallout.
- The trade imbalance with China is about 11% lower in 2019 year-to-date compared to the same period in 2018. This falling deficit with China, presumably tied to higher U.S. tariffs, is more than offset by increasing trade gaps with other countries such as Mexico (up 29%), South Korea (up 22%), Japan (up 8%) and Vietnam (up 40%). – Data calculated from U.S. Census Bureau, through September 2019. In fact, the biggest benefactors of U.S. tariffs on Chinese goods are other countries, especially Mexico and Vietnam.
- and, arguably, it leaves the U.S. with an excess of inexpensive goods.
- Treasuries are U.S. government issued debt.
- Followed closely by Japan.
- I remember paying 6.5% interest on my first home mortgage in 1997. At the time, I said to my wife, “We will not see rates this low again in our lifetimes.” This is because 6.5% was low, relative to historical standards. Of course, I was wrong (again). Subsequent real estate purchases we made were at lower mortgage rates. Each time, I thought, these rates are so low, we should lock them in for 30 years, which we did, rather than opting for a variable-rate mortgage. This turned out to be an expensive (although risk adverse) decision. Wrong again. I still maintain this is the best approach, especially in the low rate climate we continue to enjoy today, which won’t/can’t last forever… but I might be wrong on this point too.
- This does not automatically imply causation… but it’s notable. And plausible.
- or physical changes, like a significant natural disaster or viral outbreak.
- The counterpoint here is that by reducing the demand for Treasuries, China would decrease the value of the dollar and would adversely affect their advantageous pricing for future trade. In this sense, we are joined at the hip with China – a delicate balance of interests.
- The World Bank estimates that a country reaches a tipping point when the debt-to-GDP ratio approaches or exceeds 77%. The U.S. is at 103%.
- Source: TreasuryDirect
- The main difference between a Treasury Bill, Note and Bond is the duration of each. Bills: less than a year. Notes: 2-10 years. Bonds: 30 years.
- There are about 250 governmental departments that hold U.S. Treasuries (I counted), including Medicare trust funds, Military Retirement and Health Care funds, Civil Service Retirement and Disability funds, etc.
- I originally wrote this a month ago. Consequently, I updated the numbers today. In doing so, the debt per citizen increased by $1,000… just in the last month!
- This is the current average interest rate the U.S. pays on its outstanding debt.
- 10-year Treasury rate, October 1981.
- That is the amount of money the government should have in the coffers today to fully fund future obligations of these programs going forward, given certain assumptions about future obligations and future returns on investment.
- By “too far into the future”, I mean “further out than the length of a politician’s career”.
- The following stats are taken directly from the Social Security Financial Report.
- Recall in the 2000 Presidential election, Al Gore said he would put the Social Security Trust Fund in a “lockbox”. Understanding how the Fund is required to loan excess money to the government, makes this statement sound a little ridiculous.
- Companies are valued based on the present value of projected future cash flows the company is expected to produce. If the discount rate used to get the cash flows in present value goes up (due to inflation), the present value is worth less today. A small change in discount rates has a profound affect on stock market valuations. Hence, recession concerns.
- Social Security investing its trust fund in publicly traded equities is a sign that the end is near.
Interesting read. Sounds like a great time to add additional massive government programs like Medicare for All, and free college. Heck, let’s throw in free childcare while we’re at it.
That is what we have in Sweden and we are not doing so bad ???
We have done just that already, in Sweden (close to anyway).
Great article, I’ve been following this data for a while with similar conclusions.
Would be like to hear your recommendations to see how they line up with the recommendations of others – “prepare your gardens and be prepared to defend those gardens”.
Jeff – thanks for your comment.
To profit from this thesis, borrow as much as possible, with a fixed rate, for as long as possible. The idea is to lock in these historically low interest rates.
In other words, the investment strategy is to arbitrage interest rates and inflation over time. I believe this is the single best 10-20 year investment thesis right now.
For individuals, the best mechanism for borrowing at a fixed rate is through real estate and a 30-year fixed rate mortgage. A 4.0% loan locked in for 30 years might seem exceptionally low 10-15 years from now. And, with inflation, the underlying asset should appreciate while the debt will diminish in its relative value.
There are other strategies (like shorting the bond market), but I think real estate is the best play.
But most importantly, ignore everything I have said, because something will come along and make it all untrue.
Absolutely excellent!
Insightful and clearly written.
You have another draft for a book here. A book that already exists, but you would significantly improve upon it in my opinion: Economics for Dummies.
Thank you for the positive feedback. I appreciate it!
I believe it was footnotes #12 & 16 that captured my attention so thoroughly that everything else palled. That’s a lot of numbers to digest. So, maybe I will just focus on why this i-phone 11 will not bring up footnotes like my old #5 did…and leave all of those dire thoughts to you young ‘uns while we seniors grieve over the loss of statesmen who served for all the right reasons & a people who worked & fought for what seemed right who became a people who felt they were entitled. And, to say I am sorry your generation is having to deal with the mistakes we have made & are making.
Oh, & one final thought…good job.
Thanks for the comment.
I suppose it’s a worthy goal for the sum of each generation’s mistakes-and-failures to be less than the sum of its successes and overall contribution to the benefit of generations that follow. There is much discontentment, even resentment, among younger people right now, aimed at older generations. They would do well to also review the great strides forward presented by those same people… and to incorporate some element of gratitude as well.
It is well written. Did a good job of taking hard concepts and making them plain for the simple man, like me. If however, the world is falling, why are not more people talking about this and not other things. Is it too big a problem to solve or too hard to face the reality to come?
Easily the most complicated economic issue I have ever understood. I realize this comment could reflect on both of us, but I am using this feedback to focus on the fact you are a gifted writer AND teacher. Your article provides great insight! Clearly, I have no idea how accurate your predictions are, but surely we are all hoping you forecasted a few items imprecisely, despite your brilliance.
Now, time to do an article on something requiring less concentration. Perhaps, college pranks gone wrong…
Thanks for the feedback and compliment. I really appreciate it.
Regarding college era improprieties – those stories are potential unfunded liabilities, and thus better told off-the-record, especially if they are true.
Thoughts – in no particular order…
1. Yes, there’s no way interest rates remain this low. But the challenge with real estate is that, at some point, you have to sell it. If the next generation can’t afford the current McMansion prices, prices will fall. If the bulk of your wealth is locked up in a house you can’t afford the taxes on…
2. The Trump Administration tariffs are just incomprehensibly stupid and show a fundamental misunderstanding of the interconnectedness of a global economy.
3. Privatizing Social Security or using the funds to invest in the market is dumb for the very good reasons you outline, but also because it is the last line of security for millions. If the government loses that money, or the money they have is worth less than it is now, the government will still figure out a way to not let people starve. Something will be done to shore it up eventually – some combination of upping the age, taxing ALL income not just the first $120k or so, perhaps taxing capital gains, and lowering benefits.
4. Yes, it’s cheap to borrow, so the government should use these low rates to their advantage and let all of my neighbors who got rich off of defense contracts get rich off infrastructure projects instead.
Enjoyed this Blog. I woke up the other night at 2 in the morning and could not sleep so I decided it would be a good time to read your latest writing.
I found it very interesting, interesting enough to keep me awake to the end.
I agree with the affect of the tariffs but still think it is the right thing to do. Zero tariffs would be ideal, and we will never get there if we don’t stop getting run over, continuing as it was I don’t think is the answer it would only make things worse later.
The rest of the blog sounds almost exactly like Tim Ryan’s campaign speech when he ran as Mitt Romney’s VP in 2012. The opposition destroyed him by showing ads with him pushing grandma in a wheelchair off a cliff. Ryan said then that if we don’t do something about SS and entitlements now (2012) we will face dire consequences by 2020. You would make a good Republican.
David – thanks for reading and for your comment. Interesting perspective about tariffs… that we should add tariffs in an effort to eventually force negotiations to aim for no tariffs. Perhaps. There is also the argument that some tariffs are warranted in instances where governments are unfairly supporting certain industries, allowing them to be more competitive than they would normally be.
Finally, regarding my political affiliations, I find I can agree with either side or neither side, depending on the issue. As such, I’m afraid I would make neither a good republican nor a good democrat. I am insufficiently tribal.
As always, this is a great summary of what’s what, Andy, and excellent assessment of possible outcomes.
I have read on some of this in other places and your views are very consistent with what the data suggests.
What seems very obvious to me is that the root problem is clearly political: the policies that have landed us in this mess are implemented by politicians (and the parties themselves) that have ZERO incentive to work any differently since the actions that created the problem rewarded them handsomely. Even electing “fiscal conservatives” does not appear to really move the needle on these issues as I too remember the rhetoric in the 2000 presidential campaign.
Outside of the investment strategies you have so carefully caveat-ed, do you see any possible strategies the voters can do in order to add the proper incentives to the political system?
[…] be a tipping point for the economy. On November 11, 2019, I published my thoughts in a blog titled Tariffs, Debt, Social Security & The Fed – an Economic Theory, where I argued the U.S. was in a very precarious position on too many economic fronts. We were […]