
I bought a 50 lbs. bag of rice at Sam’s six months ago for $20. I know, that’s a lot of rice. But it was cheap!
This week, I was shopping at Sam’s again and saw the same rice product, priced at $26 per bag.1
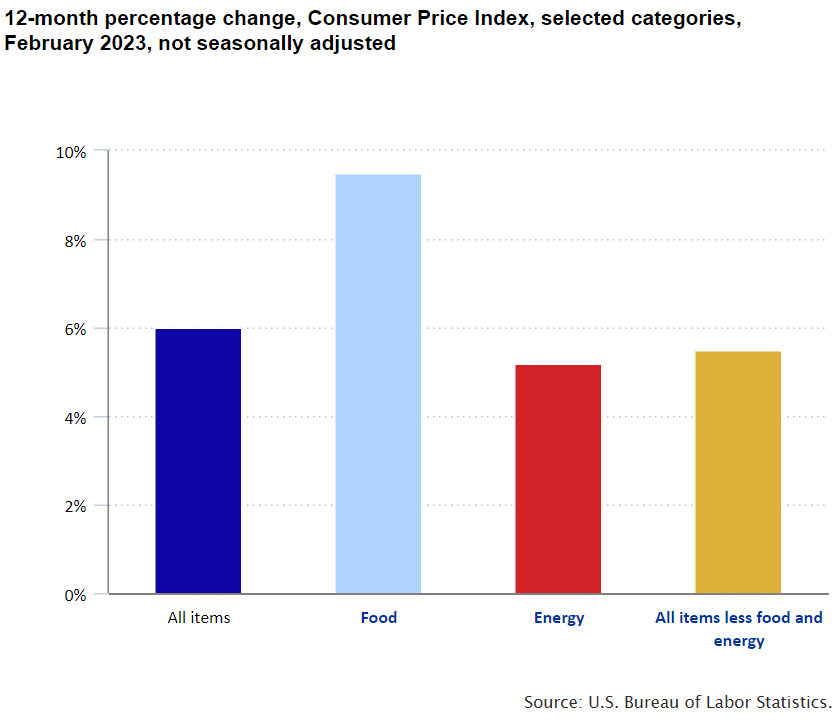
That’s 30% inflation over 6 months! How does this square with the reported 12-month Consumer Price Index inflation rate of 6.0% (9.5% for food)?2 See chart below.
I discussed this, in part, in a previous blog post titled: Why Inflation Feel Like It’s More Than Reported. I’ll cover this again in a little more detail below. But first, an economic backdrop to the discussion.
The Economics of Inflation
The concept of inflation is not intuitive. We first learn about it, hypothetically, in 8th grade economics class. We only vaguely remember this class because half the time we sat there not paying attention, entertaining our brains with non-economic thoughts (what we might have called “boredom”), while the teacher droned on about Scarce Resources3 and other obscure concepts. We used the other 60% of the time in this class as an emergency cram session to complete homework due in the next class.4 Probably something important… like speling homwerk.
Consequently, we only retain two parcels of knowledge from 8th grade economics:
- When in doubt, go with supply-and-demand as the most probable answer on the quiz. Supply-and-demand is not an intuitive concept either, but easy to understand once explained in simple terms, unlike inflation, which is also easy to understand if explained in simple terms. It just isn’t explained in simple terms. At least, not in 8th grade. To me, inflation is like a second derivative of supply-and-demand economics. So, that should clear things up.
- Don’t get caught throwing paper wads at your friends during class. It’s not a bad idea to throw things in class, especially at the person who first launched it at you. Getting caught is the issue I’m addressing here.
Inflation According to Andy
Students and adults alike often don’t understand the drivers and mechanics of inflation.
Most people think inflation is the rate of increase in prices of products and services. In fact, this approximates the textbook definition. But it’s technically incorrect (according to Andy).
Price reflects the purchasing power of a currency for a particular good or service in a moment-in-time, a snapshot. Price does not reflect the value of a good or service. In other words, price only relates the current value of a product or service to the current purchasing power of the currency being exchanged for this value. That currency-value relationship changes over time.
Generally, the actual value of something doesn’t change much over short durations – say less than a year.5 The value of a bag of rice, for example, is the same this year as last year, because it satisfies a basic function of “something to eat with a fairly constant caloric count that keeps me alive a bit longer”. But the price has changed substantially from last year.
Why?
Well, it’s not that the value of the bag of rice has changed for us. It just takes more dollars to purchase the same amount of rice because the dollar is now worth less.
And that is the key difference and the proper way to think about inflation.
Broad, macro-inflation is often due to the decreased value of the currency, rather than the increased value (and thus price) of products and services.
Currency Depreciation
The dollar has lost substantial purchasing power over time, especially in recent years.
Again, why?
Like other products, currency is also subject to supply / demand balancing.
Here’s the path:
Print more money = Greater money supply = Lower value of a unit of currency = More currency required to purchase items = Higher prices = Inflation
Same idea, stated differently:
Print more money = Greater money supply = More money to spend in the populace = Greater spending of that money = Higher demand for goods and services = Higher prices for those goods and services = Inflation
In either case, if we skip the middle terms in the equation, we get:
Print more money = Inflation
This is what I meant by inflation being a derivative effect.
Inflation is the result, not the cause.
In other words, broad market inflation is the result of supply/demand imbalances in the currency, often owing to the excess printing of money.6
And it’s not just the dollar. Many currencies globally have declined substantially. Said differently, inflation has increased globally, as many countries’ Central Banks have printed more of their own local currency in recent years.
Unfortunately…
You Don’t Get Richer By Printing More Money
I’ve heard multiple people suggest we should just print more money to become wealthier.
It doesn’t work that way.
Well, some people (and companies) do get richer, while others effectively get poorer. The distribution of the newly printed funds is rarely equally distributed, by design. Consequently, it skews wealth, often with unintended secondary and tertiary effects.
If we could create wealth as a nation by simply printing more money, we would have infinite dollars already. But we don’t.
Why not?
Because printing additional money doesn’t change the fundamental value of things, just the price.
As discussed above, printing additional money requires us to spend more money for the same value. This effectively increases the price of goods and services. We might have more money, but we must also spend more to maintain the same lifestyle.
Although inflation historically lags money printing (by 12 – 18 months), subsequent wage increases for workers usually lag inflation. Consequently, by printing more money, we create a scenario where price increases outpace wage hikes. Ironically, this results in a large swath of the populace having less purchasing power than before.
Further, this negative outcome disproportionally affects the most economically vulnerable of the population, those on fixed incomes (usually the elderly drawing pensions) and low-income earners. These demographics are often not the main recipients of the newly printed money.
Back to Rice
Rice (the commodity, not the university) experienced both broad market inflation (due to supply/demand imbalances in the dollar) as well as product specific inflation (due to supply/demand imbalances in the marketplace for this product, and similar products).
In the case of rice, there are two unfortunate external, product-specific events that simultaneously increased demand and reduced supply.
- Increased Demand. The Russian invasion of Ukraine reduced the export of wheat from Ukraine (Ukraine represents 3.1% of global wheat production).7 Wheat represents an enormous caloric component of sustenance globally. The reduced wheat supply has led to a 20% increase in the price of wheat (Feb. 2022 – Feb. 2023). Rice is a caloric substitute for wheat. An increase in the price of wheat therefore leads to an additional follow-on demand for rice.
- Decreased Supply. Rainfall in India was not ideal during the last rice growing season. India accounts for roughly 24% of global rice production.8 Consequently, a weather event in India can materially impact the global supply of rice.
In addition to these product-specific events that skew supply/demand, the dollar buys less rice, due to the lower value of the dollar.
Lastly, rice (and other crops) are now more expensive to grow, because fertilizer prices increased substantially, a knock-on effect of the war in Ukraine (fertilizer production requires substantial energy resources).
Add all that up and you get the new adjusted price for a bag of rice at Sam’s.
Unfortunately, this also means some people eat less. Less than they would want.
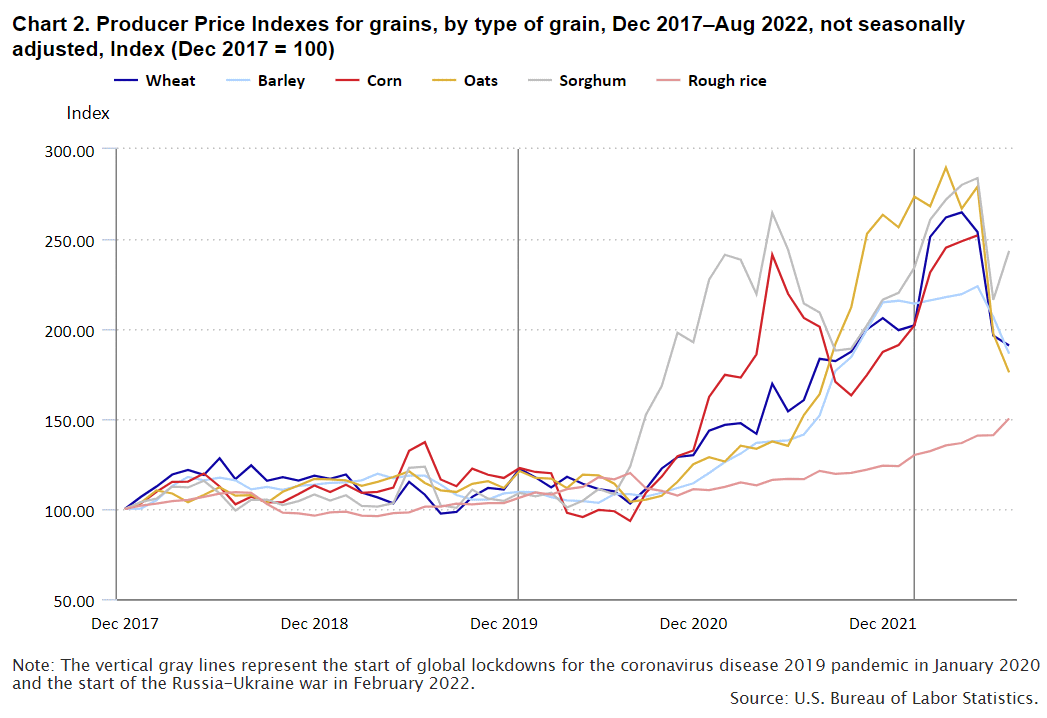
Lest we think rice is the worst case of inflation, guess what related foods fared worse? Wheat, barley, corn, oats, sorghum, and others. See graph below (rice is the bottom line).
Inflation is Greater than Reported
Inflation, as felt by lighter wallets, especially at the grocery store, is significantly greater than the reported 6% CPI number.
I’ve written about this before, so I will just touch on it again here.
The main idea – inflation is so high, it is deflationary in some discretionary product categories that make up the CPI basket of goods and services. Consequently, some optional items show very little inflation or even deflation, which brings down the reported average inflation rate.
If we rank the 346 rows of data from the CPI basket by % change in price (which I have done so you don’t have to), the items at the top of the list (highest inflation) are mostly required items:
- Eggs (+55.4%)
- Butter (+26.9%)
- Frozen vegetables (+21.4%)
- Public transportation
- Bread
- Frozen fruit
- Pet food (+15%)
- Sugar
- Bakery products
- Canned fruits
- Transportation
- Cereal
- Rice, Pasta & Cornmeal (+13.6%)
- Potatoes (+13.5%)
… just to name a few.
At the bottom of this same list, we see more discretionary items:
- Smartphones (-25.1%)
- Calculators (-18.3%)
- Televisions (-14.8%)
- Used cars
- Information technology
- Video and audio products
- Major appliances (-5.9%)
- Computers
- Laundry equipment
- Clocks
- Lamps
- Men’s footwear (-0.2%)
Comparing these two lists, I think you get the point.
We are collectively opting to defer maintenance on optional purchases in favor of required purchases, like food. This is likely because a certain portion of the population has little choice as food consumes too much of their budget.
Inflation Waterfall
Much like the price of rice is related to the price of wheat due to the substitution factor, other products and services are related, but with longer delays between need and substitution.
In the case of wheat and rice, the time lag is short, because people need to eat. This is not something you want to delay for long, although many people globally are doing just that.
Other less essential products and services will eventually catch up in price as the collective population can no longer delay some of these purchases. Sure, some things just won’t get purchased (expensive watches), but other items will eventually transition from want to need (men’s footwear, for example).
Speaking of men’s footwear, apparently, men have delayed the purchase of new shoes during this time of inflation to buy higher priority items like food.9 But eventually, shoes need to be replaced. When the old shoes are no longer sufficient, people will buy shoes again. This will eventually increase demand for this product category, and we will begin to see the inflationary effects on footwear, albeit delayed a bit.
This cascading waterfall effect of inflation will trickle through the more optional product categories, creating a delayed inflationary pressure across nearly the entire CPI basket spectrum, over time.
How long do men collectively delay the purchase of a new pair of shoes? I’m not exactly sure, perhaps as much as a year.
Other discretionary items include “major appliances” (down 5.9%). For a season, to buy food and other essentials, we have collectively opted to repair the old dishwasher rather than purchase a new one. We might even wash our dishes by hand next to the broken appliance. But eventually, people will replace the broken dishwasher with a new one. What’s the delay for this? Again, I don’t know, but it’s probably a longer hold out compared to the delay for shoes. Perhaps even until the house goes on the market for a move… maybe even 5 years.10
Eventually, our collective deferred maintenance will catch up with us, as some optional purchases of today eventually become required purchases of tomorrow. The consequence – inflation will trickle down to other products and services in the CPI basket. This will be the long tail of inflation distribution, as the inflation wave moves across the basket of goods and services over time, averaging almost everything up, even after food prices stabilize. I suspect this mostly begins when wage increases offset the basic costs of living. When families get some financial breathing room, they will then begin to purchase those delayed items.
This further reinforces my thesis…
Inflation is here to stay for quite some time. It will remain higher than expected and will last longer than projected.
I’ll stop here, as I am now encroaching on a separate article about why we will have substantial inflation for much longer than currently projected, but for different reasons than stated above. Stay tuned for that fun analysis and discussion at a later date (fun for the whole family).
I hope this serves to paint a picture of how inflation works and how I expect it to propagate over time.
As always, a disclaimer when I discuss topics in finance and economics – I’m probably wrong.
Follow Past Midway if you would like an email notification of new posts.
FOOTNOTES:
-
To be clear, by “shopping”, I mean I was pushing the cart, shadowing Sofie around the store. I noticed other dads doing the same double-arm-lean-on-the-red-handle method of cart pushing.
I saw one dad who didn’t even bother. His 10-year-old son was pushing the cart, with two younger kids riding along. Dad was just mind-numbingly following, clearly elsewhere mentally. This is what triggered this dad-cart-pushing observation for me. This man became a symbolic representation of the pinnacle of shopping self-awareness – dad shopping nirvana – the realization and full acceptance of incompetence in this area of life, evidenced by the glazed-over look in his eyes, slowly looking around, seeing nothing.
The rest of us were still pushing the cart, pretending to help, much like dads pretend to cook dinner by watching the meat on the grill outside while drinking beer, often their sole contribution to meal preparation. Anyway, I like to go to Sam’s with Sofie and push the cart… because I get to spend time with Sofie. It’s like a date. Car time conversation plus a lovely stroll. And here’s the kicker, on this date, we save money. Come on, you knew. You knew. As an added bonus, I still enjoy riding the cart like a kid… a couple good pushes and hop on the back.
- Source: U.S. Bureau of Labor Statistics
- All introductory economics textbooks open Chapter One with, “Economics is the study of scarce resources.”
- Time adds an extra 10% to the most boring classes, subtracted from lunch period, obviously.
- Technology products aside, as they can decrease in value over shorter cycles due to better tech replacement products.
- I say “broad” here to recognize that we can have local supply/demand imbalances in individual products like rice. For the purposes of this discussion, I’m referring to broad-market price increases. That is, increases in the Consumer Price Index, a measure of inflation (a poor one in my view because the basket of goods and the relative weight of the items in the basket kind of sucks… a separate discussion).
- Source: World Economic Forum
- Source: World Economic Forum
- Women’s footwear is only up 2.9%. These pseudo-optional purchase decisions have clearly been delayed, relative to more important items in more basic categories.
- Maybe longer, because people aren’t going to be moving as much as they used to. Why? Because they would be giving up a low interest rate mortgage in exchange for a high interest rate mortgage. The economics of a move has become less affordable. “Let’s just stay where we are,” they say.
I very much doubt you are wrong not because I am an economic expert, but because I know you are.
Interesting blog. Like your mom, I am not an economic expert, but your thesis makes sense to me.
About your footnote – like you, I also am a “couple good pushes and hop on the back” kinda person! Who says kids get to have all the fun? And the carts at Lowe’s are by far the smoothest and go the farthest. Not to mention those long, empty aisles when you are out late shopping for another box of nails because you ran out before the project was finished! haha